Cannabis Topicals: A look at category data & performance

Introduction
We live in a time where many of us can drop a bath bomb filled with THC or CBD (or both!) into our tubs and relax by absorbing cannabis into our skin; what a time to be alive. For some, Topicals provide another avenue to cannabis for recreation and relaxation. But Topicals can also provide consumers with powerful pain-relieving products as well, like transdermal patches and salves. In this report, we examine the data and explore sales trends of Topicals in the US and Canada to see which segments and package sizes are popular, analyze demographic preferences, and take a look at some popular and new brands entering the space in both countries.
Executive summary
When we look at market share trends over the past few years, we can see that the market share of Topical products has been approaching a stabilization around 0.8% of the total markets in the United States and Canada. When we separate legacy and non-legacy markets in the United States, we notice that the market share of Topicals in the new adult-use markets is less than than in legacy US markets, 0.49% and 0.81% in September 2021 respectively. Looking at all states and provinces individually, we see that Topicals are doing particularly well in Colorado, accounting for 1.33% of all sales in the third quarter of 2021. Within the Topicals category, Lotions, Salves, Gels and Creams are making up a majority of category sales with 74.5% of all Topical sales in United States markets and 53.4% in Canada.
Methodology
Data for this report comes from real-time sales reporting by participating cannabis retailers via their point-of-sale systems, which are linked to Headset’s business intelligence software. Headset’s data is very reliable, as it comes digitally direct from our partner retailers. However, the potential does exist for misreporting in the instance of duplicates, incorrectly classified products, inaccurate entry of products into point-of-sale systems, or even simple human error at the point of purchase. Thus, there is a slight margin of error to consider.
In this report we examine sales in markets where Headset provides Insights data. This includes CA, CO, WA, NV, OR, IL, MA, MI, and AZ in the US and AB, ON, BC, SK in Canada. We present all data in local currency and do not make adjustments for currency fluctuations. Topicals are defined as products which are not inhalable and are not meant for oral ingestion. This includes products like lotions, patches, lubes, and suppositories.
Market share of Topicals in US and Canada

In this first graph, we are looking at the market share of Topicals in the US and Canada and see that Topicals seem to be approaching a limit or saturation of the market share that is currently available within the greater spending for consumers.
In the US, Topicals were growing quite steadily in 2018, reaching a peak market share of 1.89% in December of that year. Ever since that point, Topicals have been decreasing in market share in the US until it leveled out around 0.8% of the market in April 2020.
Topicals were introduced in Canada in January 2020 along with other Cannabis 2.0 products and has so far reached a peak market share of 0.66% in August 2021.
Topical market share in legacy and new US markets

We take another look at market share of Topicals in this graph, but this time we break down market share in the US into two groups: legacy US markets (California, Colorado, Nevada, Oregon, and Washington), and new US markets (Arizona and Michigan), to display the trends separately.
In both legacy and new US markets, we find that Topical trends are similar. Market share fell through the end of 2020 and further declined through the pandemic in all markets except for Colorado, where we see Topicals increasing in share in most recent quarters. Topicals see total sales growth during this time, but are growing slower than other cannabis product categories, resulting in a falling market share. Sales in legacy US markets totaled $8M in November 2021, which is up about 10% from $7.3M in November 2020.
Market share of cannabis Topicals in states & provinces

Now let’s break down market share of Topicals in individual states and provinces. Topicals have the largest market share in legacy markets such as Colorado, California, and Washington. Alongside these legacy markets, we that Topicals have a larger market share in more established markets, with Colorado and Washington observing the largest market shares.
Segment shares of Topicals in the US & Canada

In this graph, we look at segment shares within the Topicals category. Lotion, Salves, Gels, and Creams are commanding a dominant portion of sales in both countries. In the US, this segment is accounting for a whopping 74.5% of total Topical sales from January - September of this year (2021).
In Canada, there is some more more diversity in segment market share. The Lotions, Salves, Gels, and Creams segment accounts for the majority of sales at 53.4%. But there are also two other segments with significant contributions to the Topicals category in Canada: Bath Salts, Soaks & Scrubs have a market share of 19.9% and Transdermal Patches have a market share of 21.9%.
Prices of cannabis Topicals in the US & Canada
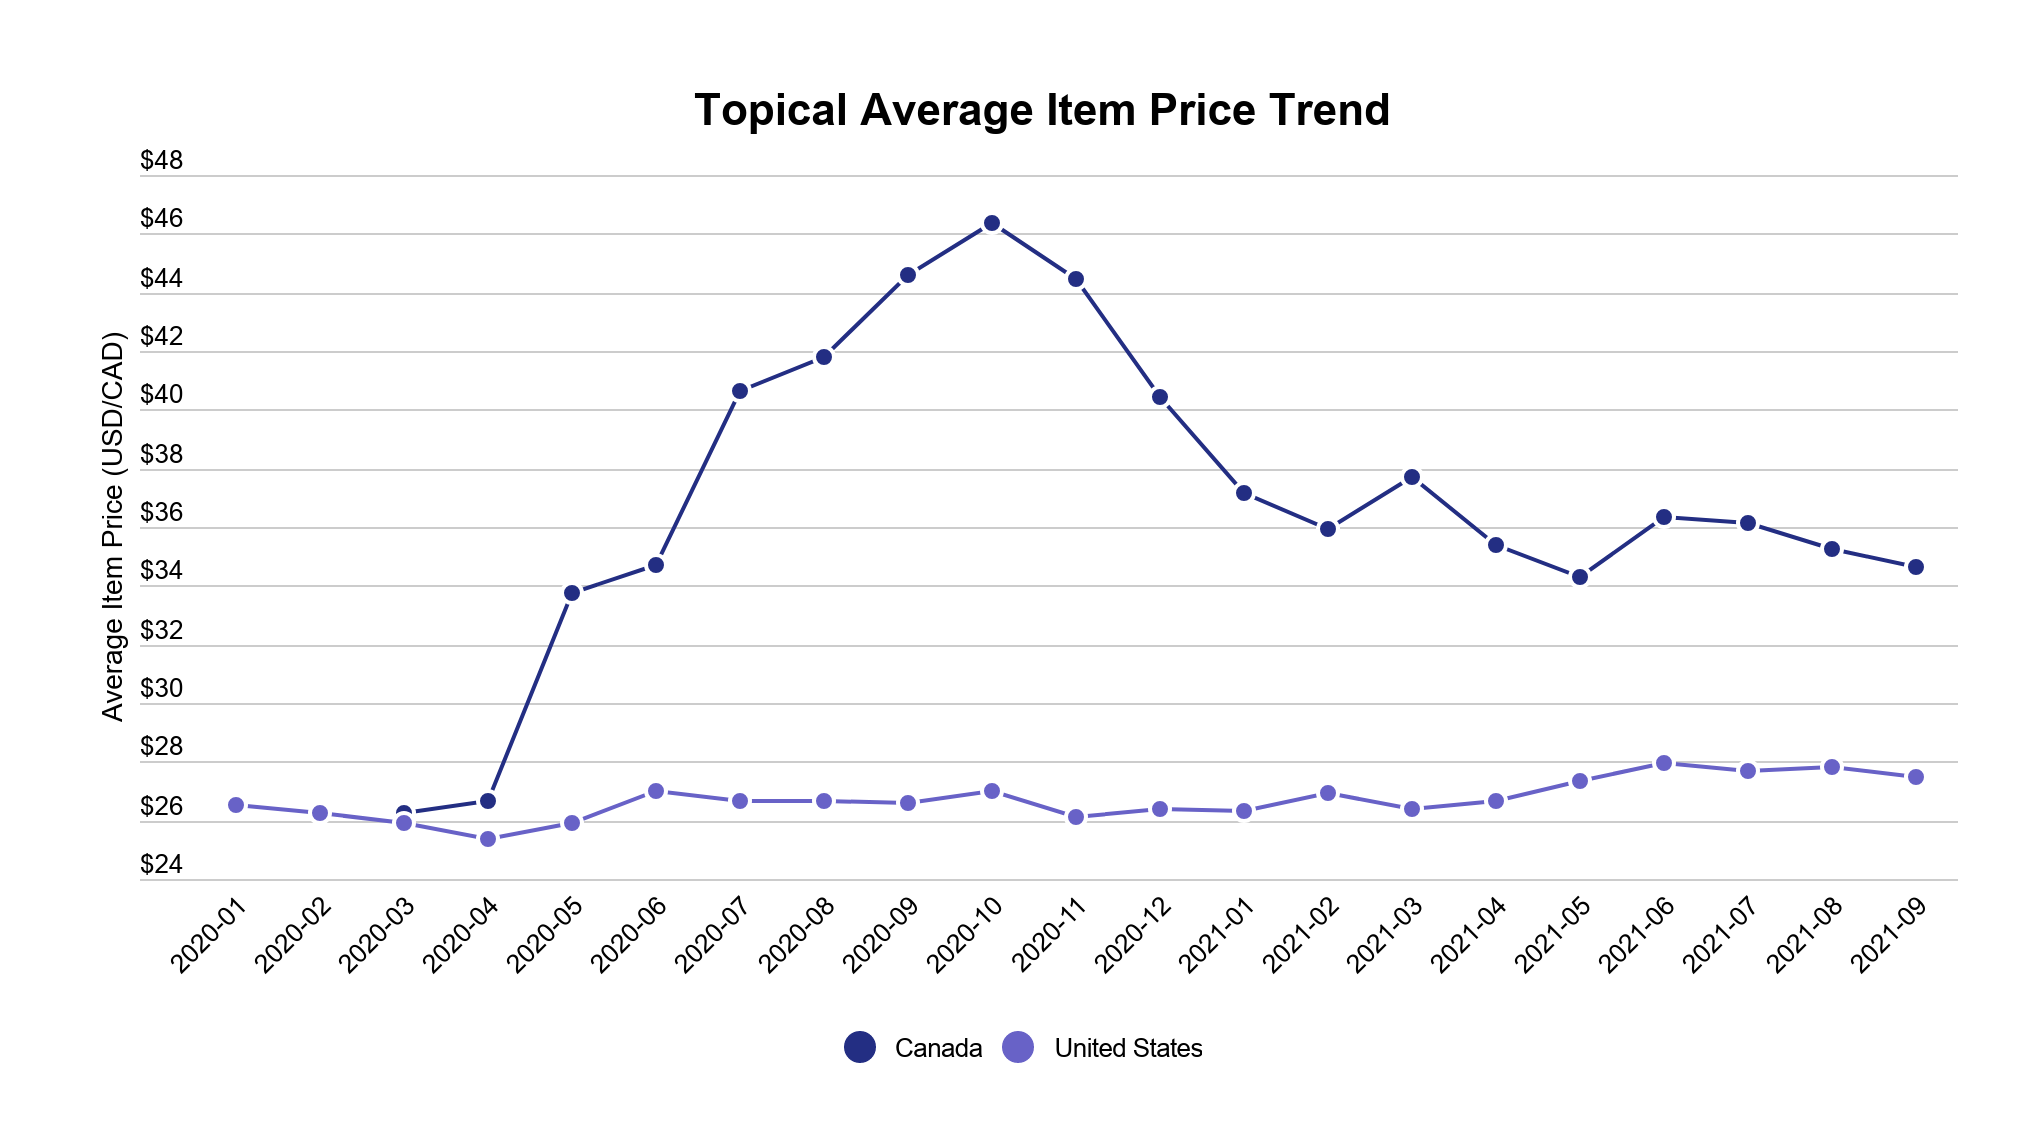
Now let's look at prices of Topicals in the US and Canada. The average item price within the Topicals category in the US has been consistent since January 2020. Canada, on the other hand, has experienced more turbulent pricing patterns of Topicals throughout the past 18 months.
Canada experienced strong growth in the price of Topical products from March 2020 until a peak around October 2020 at an average price around $46 CAD. This makes sense, since the Topical category was new in Canada around this time and initial prices of new products can be high as there is constrained supply with new demand. As new brands and products enter the market, supply increases and is able to better meet consumer demand. This generally triggers price competition among brands, which eventually compresses to a sustainable level. We see this happening in Canada with prices now stabilizing around the mid $30s for an average product.
Product availability and Topical prices in Canada

Taking a look at the Canadian market specifically, we focus on the markets covered in Headset (Ontario, Alberta, Saskatchewan, and British Columbia). We find that as the number of products in the market increase, the average item price tends to decrease. This negative correlation between price and product availability occurs as new products increase competition in the space, which results in falling prices. We find prices tend to stabilize within an 18-month window, and Topicals in Canada are no exception with prices stabilizing about 13 months after the introduction of Topicals into the market.
Package sizes of cannabis Topicals sold in US & Canada
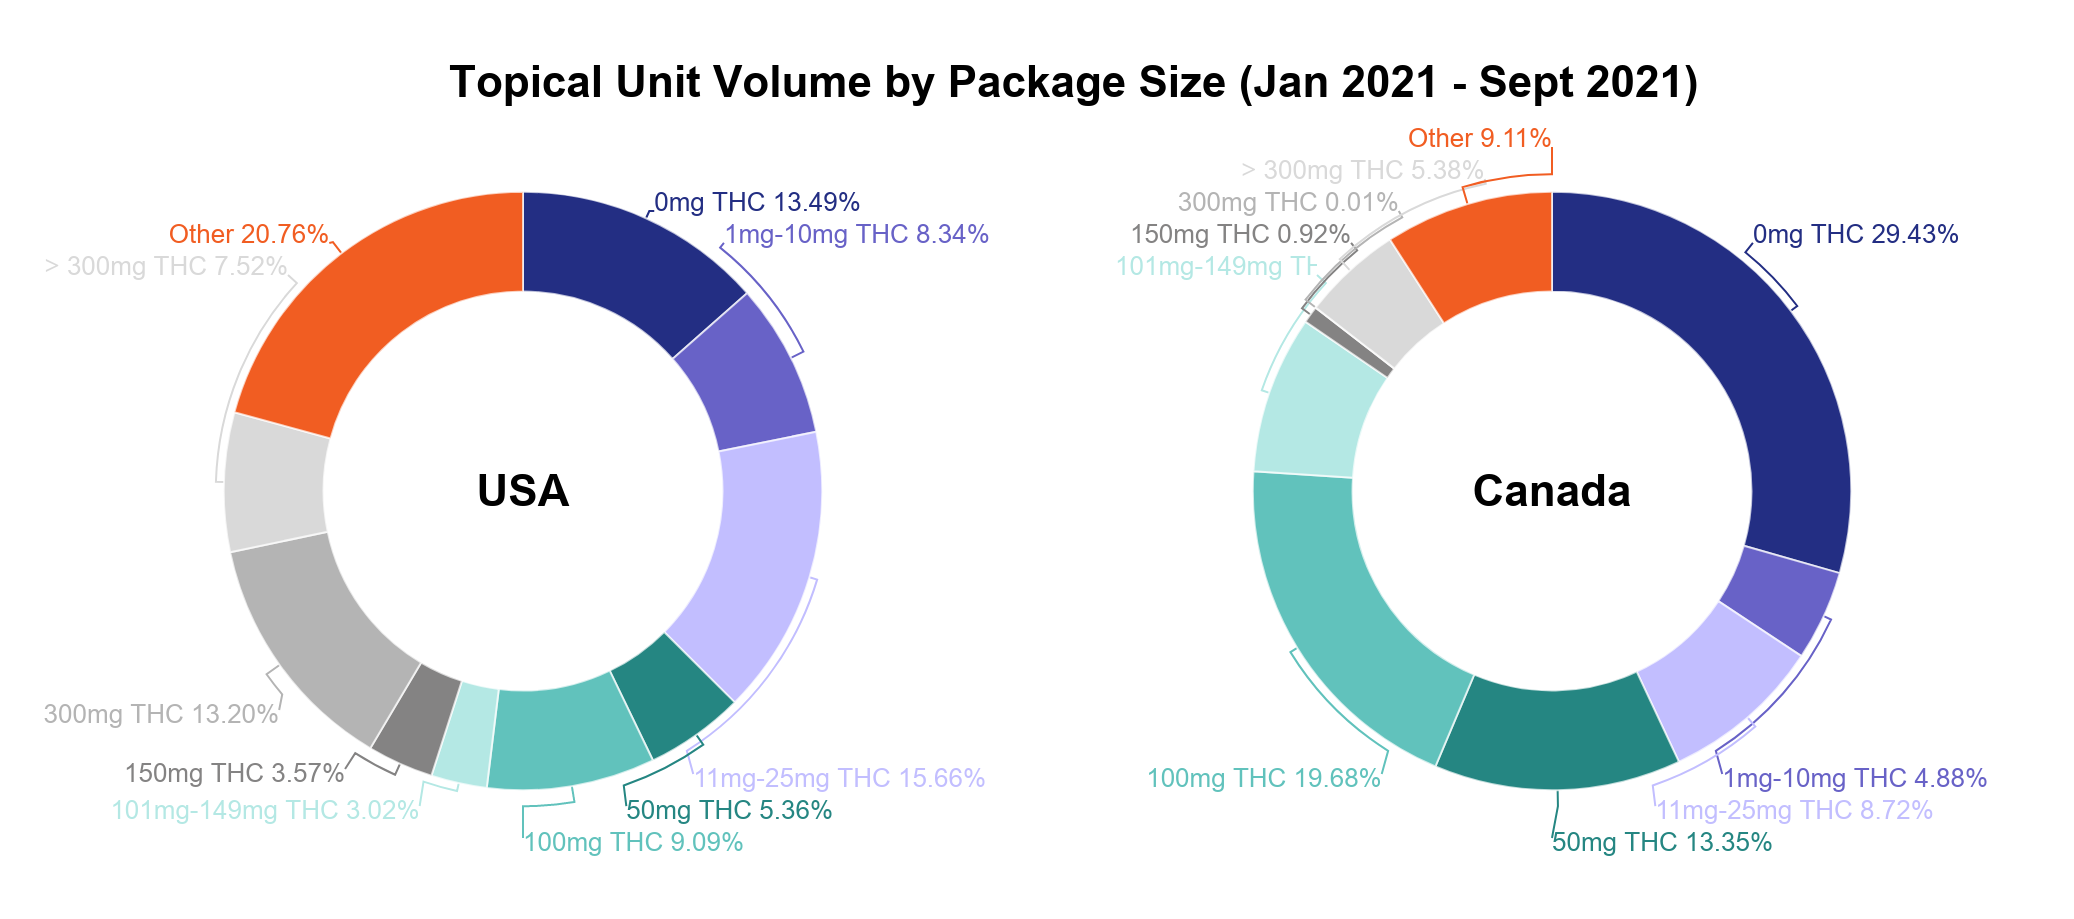
Here, we examine unit volume by package size in the US and Canada and notice some distinct differences. In the US, large volume sizes containing over 300mg of THC are leading the market by capturing 20.76% of the share within Topical sales.
In Canada, this same package size makes up only 9.11% of Topical sales for the same time period. In complete contrast to the US, Topical products with absolutely no THC are leading the Topical category in Canada with 29.43% of sales.
Topicals that contain CBD are popular in the US

When we focus specifically at product categories that contain CBD in the US, we see that non-combustible products that contain CBD are popular, with Topicals leading the trend. For every four Topicals sold in the US, three contained either both CBD and THC or were CBD-only. We see products that contain CBD with the highest share in Topicals. This has been trending up slightly over time. However, in some markets like California, we see Capsules containing CBD increasing in share quickly. We have seen products containing CBD increase from slightly less than 50% of unit volume to nearly 80% throughout the last two years.
Demographic preferences for Topicals in the US

Now, let's look at how different age groups are spending their wallet on Topicals. In this graph we can see that in general, younger populations are indexing at lower levels for Topicals than other categories. This means that younger age groups are spending a lower percentage of their cannabis wallet on Topical sales.
As the population of consumers age, their affinity for Topicals increases. For example, Female consumers in the Baby Boomer age group are indexing at 330, contributing to 15.8% of all Topical sales but only accounting for 4.8% of the entire cannabis market. On the other side of the coin, Millennial Males make up 34% of all spending within the entire cannabis market, but only contribute to 19.5% of Topical sales (indexing 57).
Sexual health and wellness products and Topical brands

Next, let's take a look at a few sexual health and wellness Topical products specifically. In the US, the Massage Oils and Lubes segment makes up 4.6% of all Topical sales across all markets from January - September 2021, which is the equivalent of $3.8M in sales. The top five brands within this segment are Papa & Barkley, Foria, Quim, Cannariginals, and Apothecanna.

In Canada, this segment accounts for an almost identical portion of Topical sales (4.6%), with a few brands leading the charge. Some notable brands in this space in Canada are Latitude, Proofly, and Apothecanna.
Beyond Massage Oils and Lube, we are seeing a myriad of new and interesting sexual health cannabis products emerging across the United States and Canada from brands such as Playboy, Oshihana, Fairwinds and Evergreen Organix. Brands focusing on building products for menstrual relief include Artemis Body Care (MI), Dr. Kerklaan Therapeutics (CA), Ceres (WA), Cosmic View (CA) and Mobius (CA). It will be exciting to continue to monitor the Topicals category to see how it expands to address even more needs and uses!
Conclusion
Whether relaxing in the tub or providing some much needed relief from aches and pains, Topicals can be an essential product in any consumer’s cannabis stash for a variety of reasons. Need some help assessing the opportunities in the Topicals market? Headset tools equip you with everything you need to stay ahead of Topicals and other cannabis categories, such as sales dashboards to keep track of category performance, demographic insights to understand the consumer landscape, and marketing tools to help you target the right customers. Sign up for a demo to learn how you can keep an eye on opportunities in the cannabis industry.
Key takeaways
- Topicals reached a top market share in the US at 1.89% in 2018. Since then, market share has been decreasing and has leveled off to about 0.8%. In Canada, Topicals have reached a peak market share of 0.66% in August 2021, which has decreased to 0.64% in September.
- Lotion, Salves, Gels, and Creams is the dominant Topicals segment in the US with 74.5% of all Topical sales. The Canada market sees more diversity in segment sales share.
- The average price of Topical products have remained fairly stable in the US since January 2020 and as of September 2021, the average price was $27.45. The Canadian market has been experiencing more turbulent pricing patterns, which makes sense since Topicals are a newer category in the market. Prices are now beginning to stabilize around the mid $30s for a Topical product in Canada.
- Large package sizes of Topicals containing over 300mg of THC are leading the US market with 20.76% of Topical sales. In Canada this same package size only makes up 9.11% of sales, but products without THC make up 29.43% of Topical sales.
- As the age of a consumer increases, so does their affinity for Topicals. Female consumers in the Baby Boomer age group account for 15.8% of all Topical sales but only 4.8% of the cannabis market. In contrast, Female consumers in the Generation Z age group only contribute 2.6% of Topical sales.

Cannabis Market Resources


