New York Cannabis Sales
May, 2026
Overview
New York’s legal cannabis market has experienced rapid expansion over the past year, with total sales reaching $155 million in May 2026. This marks a 15.4% year-over-year growth and a 4.3% increase month-over-month, signaling strong and consistent demand. The average item price in New York sits at $29.60, which is among the highest in the country, reflecting both premium positioning and the early-stage nature of the market. While there have been some fluctuations—such as a notable sales spike in December 2025 followed by a correction in January 2026—the overall trend is upward, with sales nearly doubling compared to the same period last year.
Despite high prices, unit sales are also climbing, up 29.5% year-over-year in May 2026. This suggests that consumers are not only willing to pay more but are also purchasing in greater quantities. The market’s growth trajectory is outpacing many established states, positioning New York as a key player in the national cannabis landscape.

May, 2026
Sales
Year Over Year
Growth
Market Comparison
New York’s cannabis market is now among the top five largest in the US, with $155 million in monthly sales. This puts it ahead of mature markets like Oregon ($78M) and Washington ($89M), and just behind Massachusetts ($143M) and Illinois ($130M). However, New York’s average item price of $29.60 is significantly higher than most states, with only New Jersey ($30.40) and Ohio ($30.63) in a similar range. In contrast, Michigan and California have average prices below $20.
Growth rates in New York are also outpacing most established markets. The 15.4% year-over-year sales growth in May 2026 is well above the national average, with many mature states experiencing flat or negative growth. For example, California saw a 7.5% YoY decline, and Colorado was nearly flat. Only a few newer markets, such as Ohio (+22.5%) and New Jersey (+1.5%), are seeing positive momentum, but New York’s combination of high growth and high pricing is unique.
New York Weed Prices
Category Performance


While traditional categories like Flower and Pre-Roll dominate in sales, the Beverage category stands out for its exceptional growth and innovation. Beverage sales reached $2.4 million in May 2026, up 24.4% year-over-year and 7.0% month-over-month. Notably, unit sales surged 62.9% year-over-year, indicating that more consumers are exploring cannabis-infused drinks, likely drawn by lower average prices and new product formats.
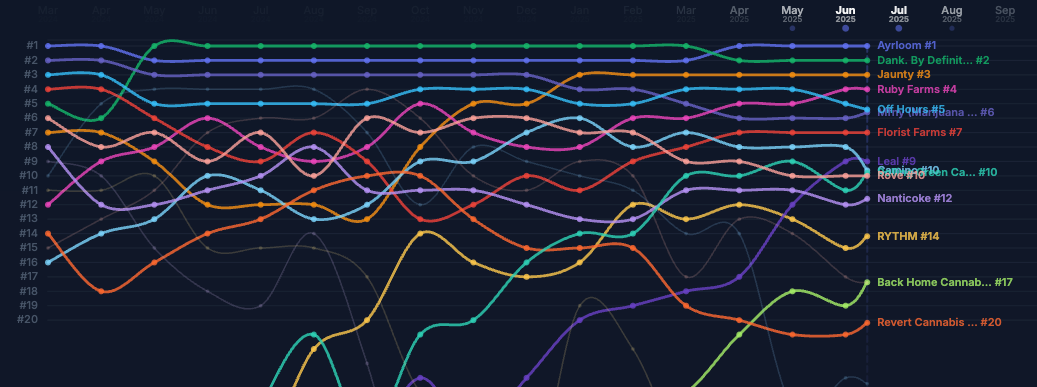
Within Beverages, Carbonated and Iced Tea, Lemonade, and Fruit segments are driving the category, both posting over 44% year-over-year sales growth and even higher unit growth. The Tea, Coffee and Hot Cocoa segment, while smaller, saw a remarkable 344% year-over-year sales increase and nearly 10x unit growth. Leading brands such as Ayrloom, Layup, and Harney Brothers Cannabis are capturing significant market share, with Ayrloom alone accounting for over $1.4 million in monthly sales.
The beverage category’s rapid growth and diversity of offerings make it a segment to watch as consumer preferences evolve.
Product Category Market Share In New York
Historical Cannabis Sales In New York
New York Cannabis Reports
.png)
New York Marijuana Trends
New York Cannabis News
Two Years In: Winners, Losers, and the Brands Reshaping New York Cannabis

mFused × Headset Bridge – Turning Inventory Chaos into a 20% Sales Lift


Get More New York Cannabis Market Data