California Cannabis Clash: LA Metro vs. SF Bay Area
.png)
Introduction
Anyone that has spent time in northern and southern California know they are two different worlds. The culture, geography, and business opportunities of the SF Bay Area are completely different than that of the Los Angeles Metro. Within the cannabis industry, people love to emphasize the difference between the NorCal and SoCal markets, but is this true that these two urban behemoths are “so different” when it comes to the cannabis biz? In 2020, Headset published a blog comparing data between the SF Bay Area to the Los Angeles Metro, now, four years later, we are revisiting the developing story of California’s cannabis market.
Methodology
Data for this report comes from real-time sales reporting by participating cannabis retailers via their point-of-sale systems, which are linked to Headset’s business intelligence software. Headset’s real-time data is very reliable, as it comes digitally directly from our partner retailers. However, the potential does exist for misreporting in the instance of duplicates, incorrectly classified products, inaccurate entry of products into point-of-sale systems, or even simple human error at the point of purchase. Thus, there is a slight margin of error to consider. In this report, we examine sales from our California data separated into geographical cohorts such as All State, SF Bay Area, and LA Metro which are made up of a sample of between 50 - 100 retailers per group located within the nine Bay Area counties and the LA sprawl as far south as Long Beach, and as far north as Thousand Oaks.
Key Takeaways
- The typical cannabis retailer in California sees $9,333 in total sales a day. Retailers in the Bay Area match this metric closely while LA Metro retailers’ daily total sales are 21% lower.
- There is a slight preference for the Pre-Roll category in the LA Metro compared to the statewide average.
- Local brands have advantages in their home geographies compared to cross state competitors in terms of total sales.
- Across the state, basket metrics such as average basket size have fallen in the last few years and average items per basket have failed to keep up.
- LA retailers have seen these trends play out at a more aggressive rate. This leaves them with an average basket size that is 12% lower than in the Bay and average items per basket at 2.2, compared to a state average of 2.4 and 2.5 in the SF Bay Area.
- Millennials capture a greater portion of cannabis sales in Los Angeles with over 48% compared to ~44% around all of California.
- In the four years since our last SF Bay Area vs LA Metro comparison we have seen the two major California urban area become more uniform following the typical trend of a maturing market .
Cannabis Sales Trends
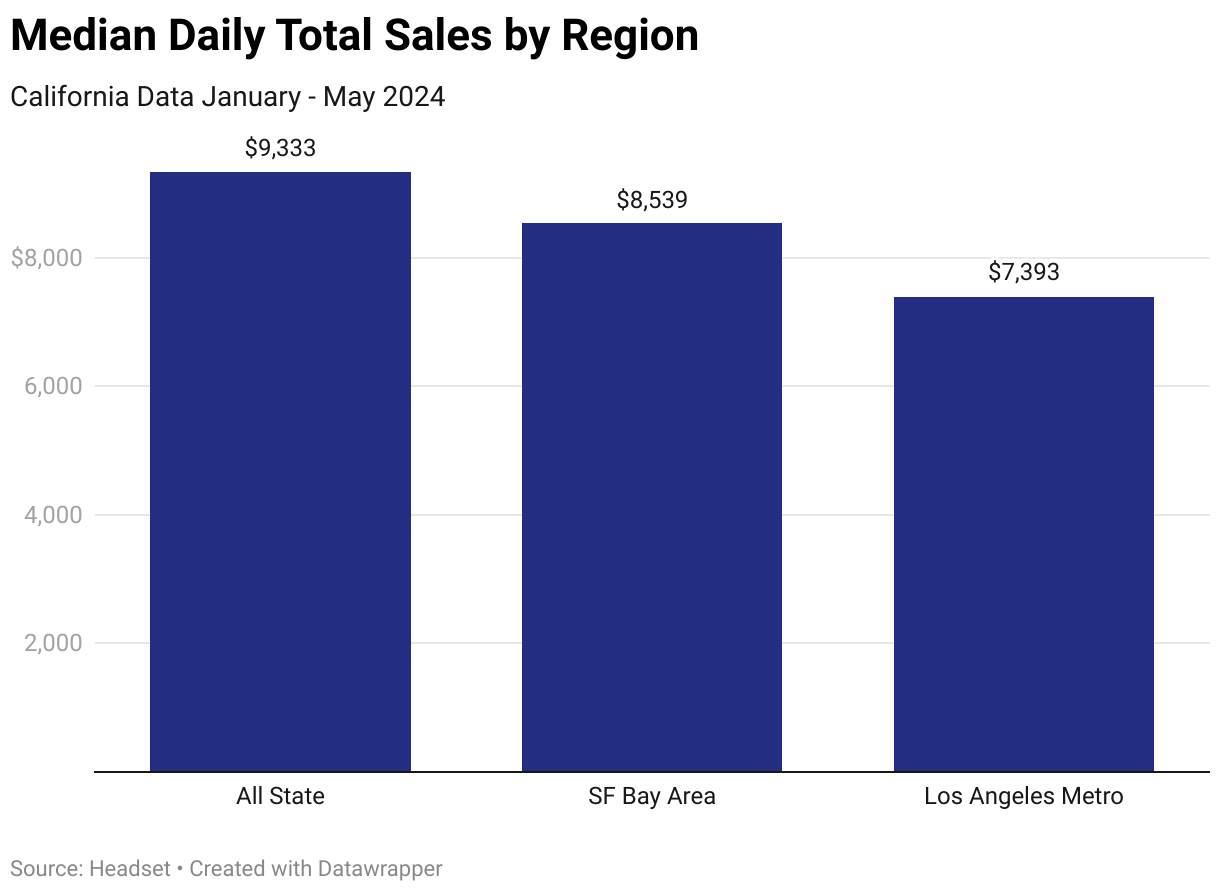
Around the Golden State cannabis retailers see a median daily sales total of $9,333 per store. How do Bay Area and LA retailers compare? Well up north in the SF Bay Area we see a similar total with the typical retailer capturing $8,539 a day. However in the Los Angeles Metro the typical retailer only sees $7,393 in total sales a day. This is 13% lower than in the Bay Area and 21% lower than the All State median. Elevated competition, strong illicit market, and lower basket metrics all can be contributing factors to LA retailer’s lower performance.
Category Preferences

Consumer category preferences across geographical regions in California seem pretty similar to one another. However, there does seem to be a slight preference in LA for pre-rolls compared to the rest of the state which sees the category capture nearly 20% of all sales compared to 17% around the state in and 18% in the Bay.
Brand Performance
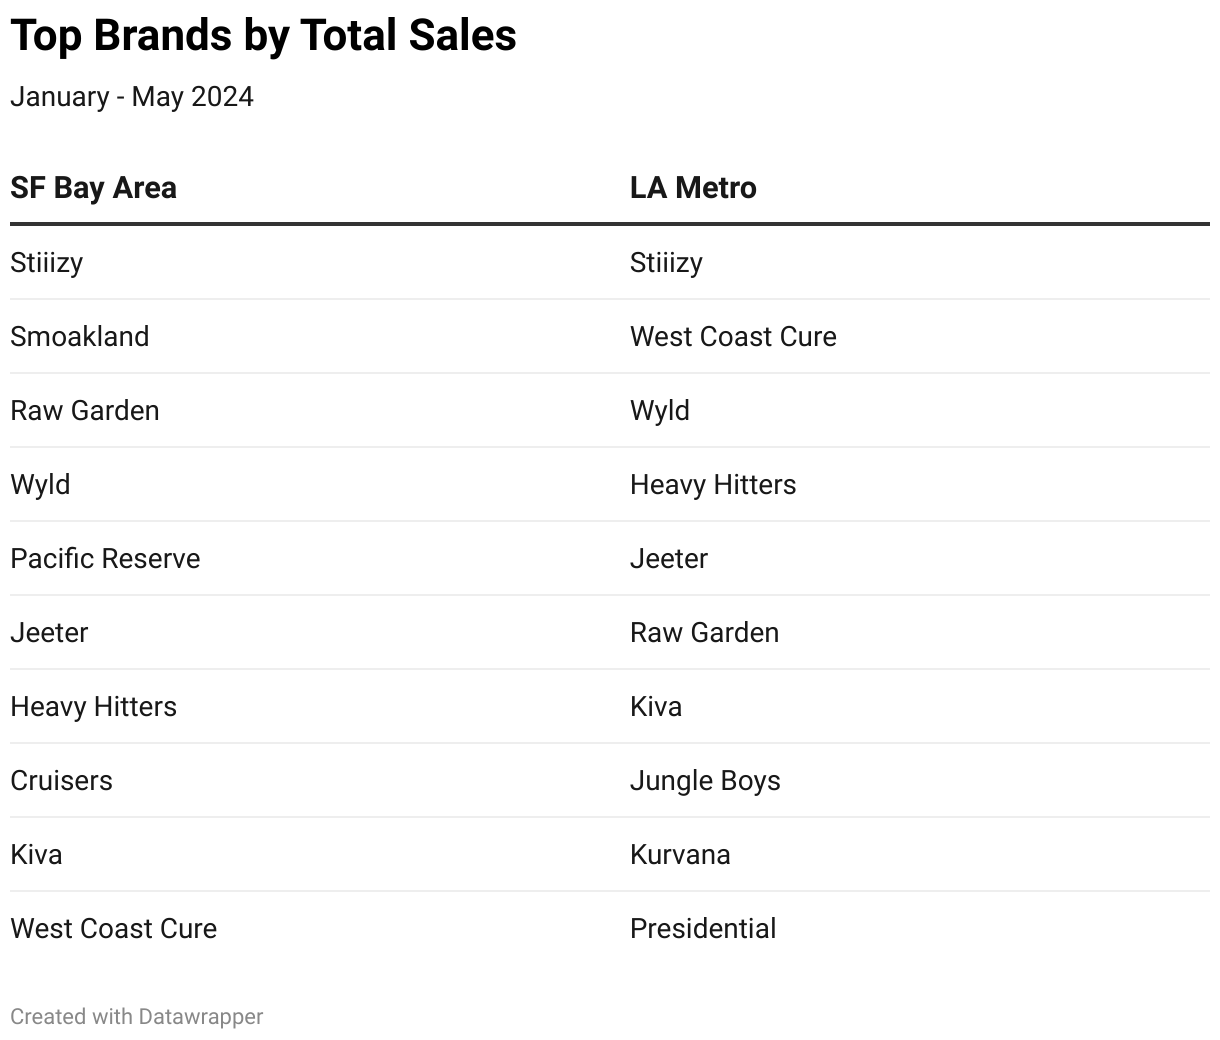
Big California brands like Stiiizy and Jeeter have achieved success statewide. However, a brand's region of origin significantly impacts its performance across the state. For instance, West Coast Cure, a SoCal brand, boasts the second highest sales in the LA metro area but barely breaks into the top 10 in the SF Bay Area. Similarly, northern brands like Smoakland and Pacific Reserve thrive on their home turf but fail to make the top 10 in LA. This allows local LA brands like Jungle Boys to secure their spots in the rankings.
Basket Analysis
As the California market has matured over the last few years prices have fallen and competitive discounting has risen. Unfortunately, retailers have not been very successful in increasing the average items per basket, thus leading to a shrinking average basket size. This trend is felt across all of California, however, as we saw with daily sales Los Angeles area retailers have felt this more than their northern counterparts.
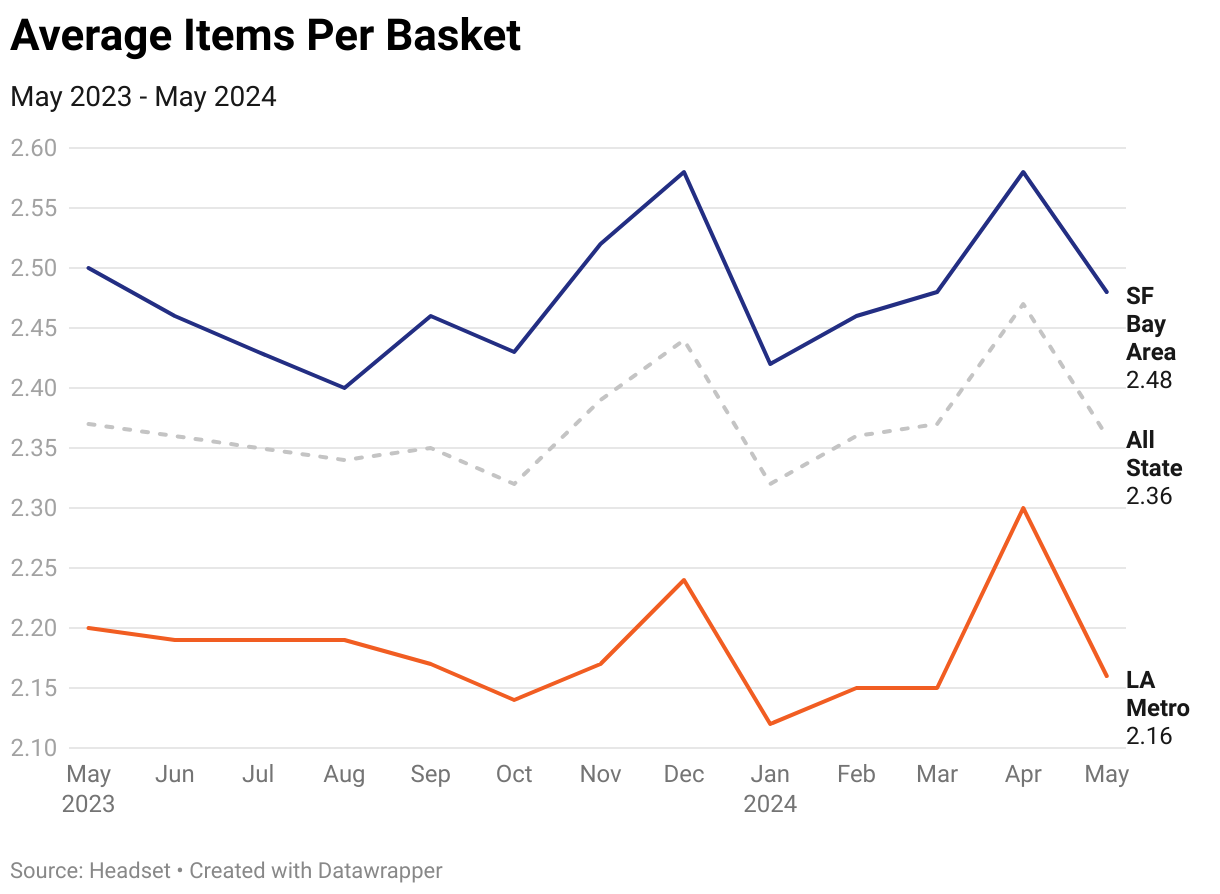
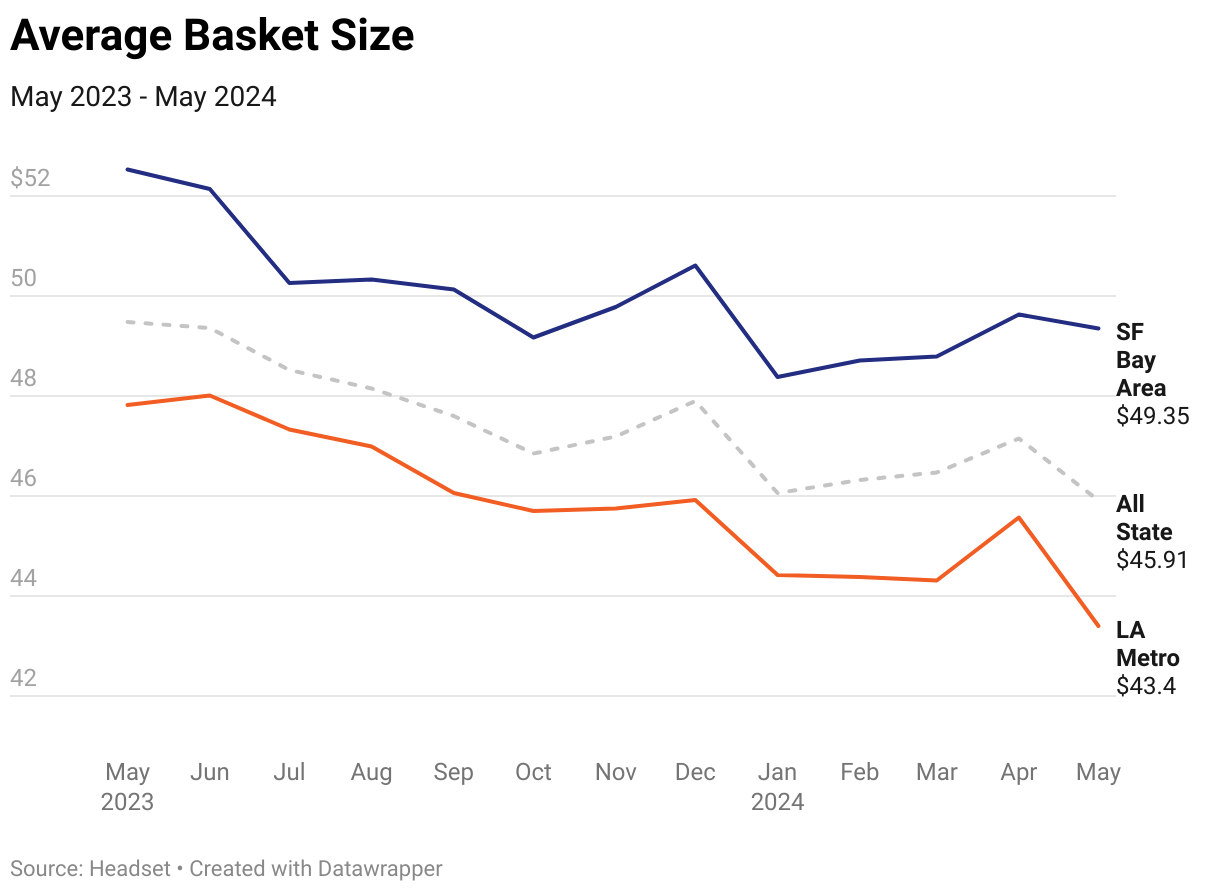
Over the last year, average basket size across the state has dropped by 7.2% to $45.91 while in the Bay Area it has decreased to the tune of 6% and is at $49.35 as of May 2024. Los Angeles on the other hand saw basket size fall 9.2% the last year to a low of $43.40. Retailers in LA also have the lowest average items per basket at 2.2 compared to a state average of 2.4 and 2.5 in the SF Bay Area.
California Cannabis Demographics

The chart highlights cannabis sales trends across California, emphasizing key differences between the SF Bay Area and LA Metro. Millennials dominate the market, making up 48% of sales in LA Metro compared to 45% in the SF Bay Area and 44% statewide. Generation Z and Generation X show consistent purchasing patterns across all regions, with Generation Z at 19% state-wide and in LA Metro, and 18% in the SF Bay Area. Generation X remains steady at around 23%. Baby Boomers contribute 14% of sales both statewide and in the SF Bay Area, but slightly less in LA Metro at 12%. These insights into cannabis consumer behavior by age group can guide targeted marketing strategies in California's cannabis industry.
Conclusion
California is a massive state with so much nuance to its geography, culture, and cannabis industry. People love to debate the differences between the north and the south and cannabis is no exception. Sure there seems to be a slight preference to pre-rolls in the south, brand performance based upon region of origin, and the obvious additional hardships of the LA retailer compared to the SF crowd. However, in the grand scheme of the California market, both urban areas closely resemble one another and the state averages, and the state of the business is only becoming more uniform. Looking at our SF vs LA geographic breakdown that we published in 2020 its clear that as the market is maturing the behavior of the various micro markets are drifting closer and closer to one another, and this claim of north vs south being “so different” isn’t quite as accurate as it once was.


