Michigan Cannabis Sales
May, 2026
Overview
Michigan’s cannabis market continues to be one of the largest and most dynamic in the United States. In May 2026, total sales reached $259.9 million, with over 30.6 million units sold. While the market has seen some volatility over the past year, including a slight year-over-year sales decline of -4.7%, unit sales have actually grown by 5.2%. This suggests that while overall revenue has dipped, more consumers are purchasing cannabis products, likely driven by falling prices. The average item price in Michigan dropped to $8.49 in May 2026, down from $9.37 a year prior, making it one of the most affordable cannabis markets in the country.
Despite the modest sales contraction, Michigan’s market remains robust, with monthly sales consistently above $250 million for the past year. Price compression is a key theme, as increased competition and a maturing market have driven prices down, fueling higher unit sales and broadening consumer access. This environment has created opportunities for both value-focused and premium brands to capture share.

May, 2026
Sales
Year Over Year
Growth
Market Comparison
Michigan ranks as the second-largest cannabis market in the US by monthly sales, trailing only California. Its $259.9 million in May 2026 sales is well ahead of states like Illinois ($129.9M), Massachusetts ($142.5M), and New York ($155.0M). What sets Michigan apart is its low average item price of $8.49, the lowest among major markets, making cannabis highly accessible to a broad consumer base.
For a deeper dive into Michigan’s evolving consumer trends, category innovation, and competitive landscape, Headset Insights offers comprehensive, real-time analytics.
Michigan Weed Prices
Category Performance


While traditional categories like Flower and Pre-Rolls dominate in size, the Beverage category stands out for its rapid growth and unique consumer appeal. Beverage sales in May 2026 hit $1.82 million, up 27.8% year-over-year—the fastest growth among all categories. Average item prices in Beverages have remained stable, even ticking up slightly to $8.68.
Within Beverages, the Carbonated segment is the clear leader, accounting for over half of category sales and posting a remarkable 54.8% year-over-year growth. Other segments like Sports and Energy drinks and Iced Tea/Lemonade are also seeing strong double-digit gains, signaling expanding consumer interest in alternative consumption formats.
Beverages are carving out a niche with innovative products and branding, and the segment’s growth far outpaces the overall market. For deeper insights into emerging segments, Headset Insights can provide a more granular breakdown.
Top Cannabis Brands in Michigan
Product Category Market Share In Michigan
Historical Cannabis Sales In Michigan
Michigan Cannabis Reports

A deep dive of the Michigan cannabis market

The Michigan cannabis market : A high-level overview
Michigan Cannabis News
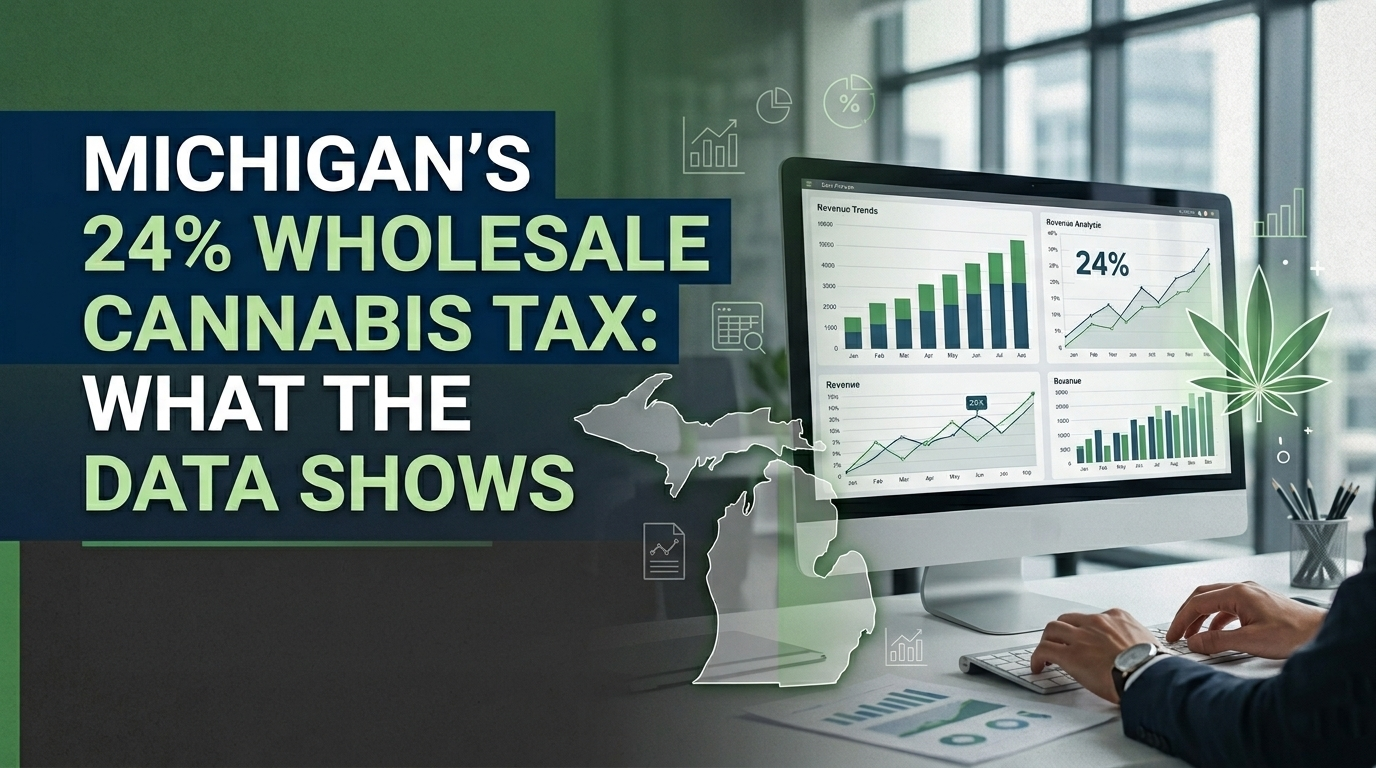
Michigan's 24% Wholesale Cannabis Tax: What the Data Shows

Can Michigan Dethrone California as North America's Cannabis Leader?

Get More Michigan Cannabis Market Data