Jan-2025
Sales
Trend
6-Month
Product Count
SKUs
Overview
Market Insights Snapshot
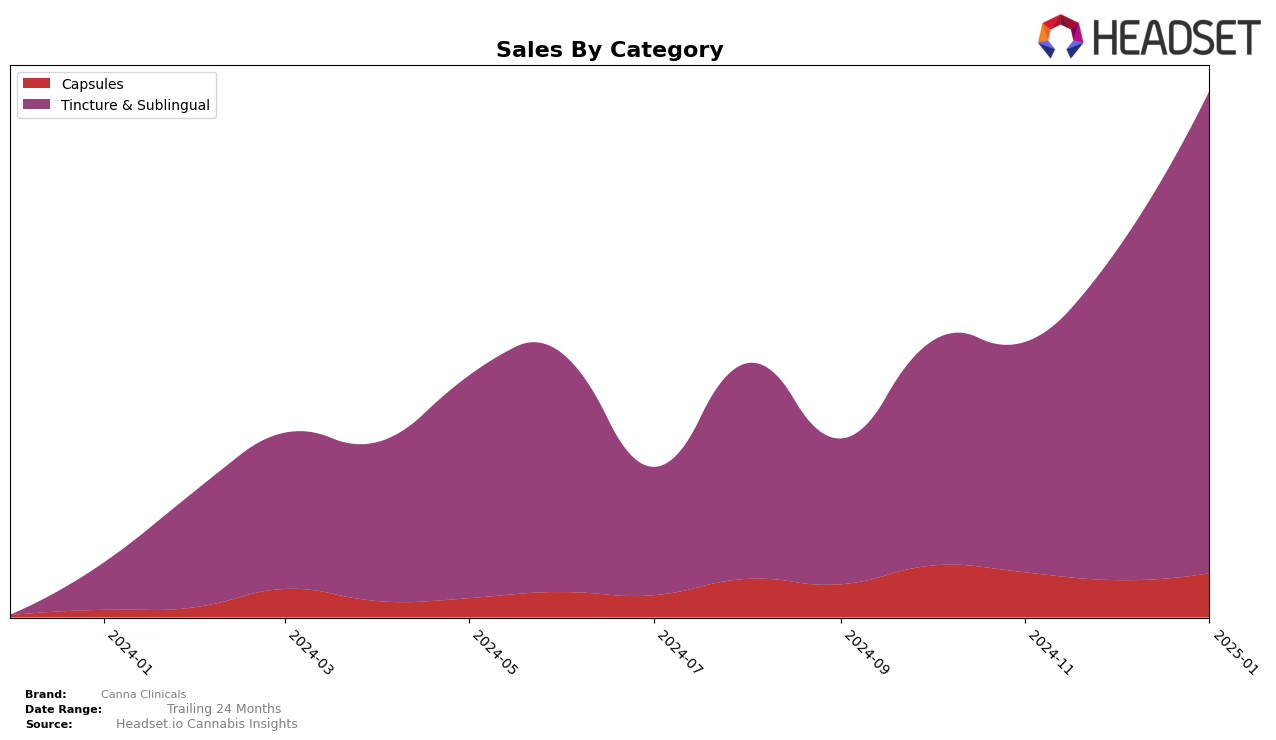
In the state of New York, Canna Clinicals has shown a consistent presence in the Tincture & Sublingual category, maintaining a solid rank of 7 from October to December 2024 before slipping slightly to 8 in January 2025. This minor drop in ranking could be attributed to increased competition or market saturation. Notably, the brand's sales figures have demonstrated a positive upward trend, with significant growth from $19,335 in October to $41,463 in January. This suggests that despite the slight dip in ranking, Canna Clinicals has managed to capture a larger market share and increase consumer interest in their products over this period.
While Canna Clinicals has maintained a notable position in New York, it is important to note that they are not listed in the top 30 brands for other states and categories, which could indicate a strategic focus on specific markets or categories where they have a competitive advantage. This absence from other rankings might be seen as a limitation in their market penetration, but it also highlights an opportunity for growth and expansion into new territories. By analyzing their successful strategies in New York, Canna Clinicals could potentially replicate this success in other states or provinces, thereby increasing their overall market presence and brand recognition.
Competitive Landscape
In the competitive landscape of the Tincture & Sublingual category in New York, Canna Clinicals has shown a steady performance, maintaining a consistent rank of 7th place from October to December 2024, before slightly dropping to 8th place in January 2025. Despite this minor decline, Canna Clinicals has experienced a positive sales trajectory, with a notable increase from October's figures to January's. In contrast, Veterans Choice Creations (VCC) and OMO - Open Minded Organics have maintained higher ranks, with OMO consistently holding the 4th position and VCC fluctuating between 5th and 7th. High Falls Canna New York has experienced a downward trend, dropping from 5th to 9th place, which could present an opportunity for Canna Clinicals to capitalize on. Meanwhile, Chime & Chill has not consistently ranked in the top 20, indicating a less stable market presence. This competitive environment underscores the importance for Canna Clinicals to leverage its upward sales momentum to improve its market position further.

Notable Products
In January 2025, the top-performing product for Canna Clinicals was the CBD/THC 1:10 Max Strength Tincture, which maintained its leading position from previous months, with sales reaching 491 units. The Max Strength Capsules 10-Pack also held steady in second place, showing a slight increase in sales compared to December 2024. The CBD/THC Unwind Tincture climbed to third place from fifth in December, indicating a growing consumer interest. The CBD/THC/CBN 1:1:1 Sleep Complex Capsules remained in fourth place, consistent with its December ranking. Notably, the CBD/THC/CBG 1:1:1 Relief Complex Capsules, which previously held a third-place ranking, did not appear in the top rankings for January.
Top Selling Cannabis Brands
Data for this report comes from real-time sales reporting by participating cannabis retailers via their point-of-sale systems, which are linked up with Headset’s business intelligence software. Headset’s data is very reliable, as it comes digitally direct from our partner retailers. However, the potential does exist for misreporting in the instance of duplicates, incorrectly classified products, inaccurate entry of products into point-of-sale systems, or even simple human error at the point of purchase. Thus, there is a slight margin of error to consider. Brands listed on this page are ranked in the top twenty within the market and product category by total retail sales volume.

