Mar-2025
Sales
Trend
6-Month
Product Count
SKUs
Overview
Market Insights Snapshot
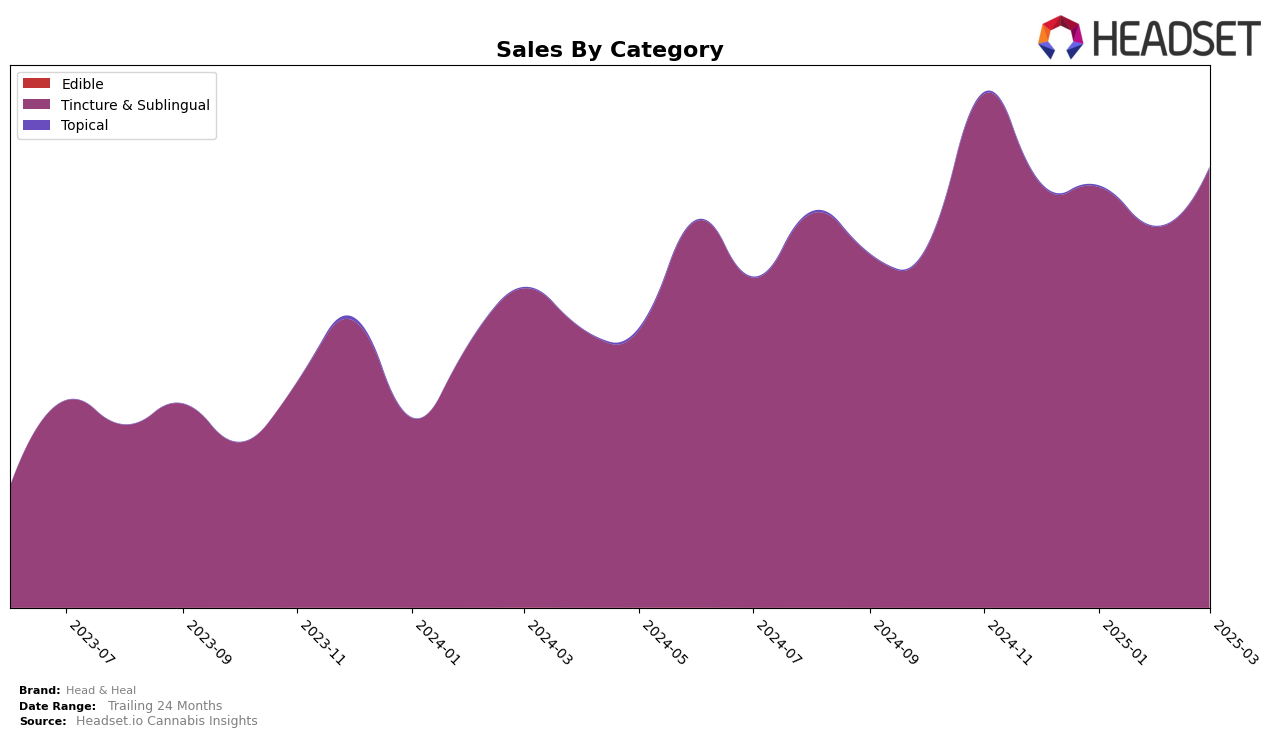
In the New York market, Head & Heal has shown a consistent performance in the Tincture & Sublingual category. Starting from December 2024, the brand held the top position but saw a slight dip to the second position from January through March 2025. Despite this minor drop in rank, Head & Heal maintained a strong presence in the top tier of the market, indicating a solid consumer base and brand loyalty within the state. This consistent ranking suggests that while there might be fluctuations in sales figures, the brand's market position remains relatively stable.
Interestingly, the sales figures for Head & Heal in New York reflect a dynamic trend, with a notable increase in March 2025 after a slight decline in February. This rebound in sales could be attributed to strategic marketing efforts or seasonal demand variations, but without further data, it's speculative. The absence of Head & Heal in the top 30 brands in other states or categories might indicate either a focused market strategy in New York or potential areas for expansion. Understanding the factors driving these movements could provide deeper insights into Head & Heal's market strategies and future growth opportunities.
Competitive Landscape
In the competitive landscape of the Tincture & Sublingual category in New York, Head & Heal has experienced notable shifts in its market position. Initially holding the top rank in December 2024, Head & Heal slipped to the second position from January to March 2025. This change in rank is primarily due to the consistent performance of Ayrloom, which maintained the first position throughout the same period, with a significant increase in sales. Meanwhile, Jaunty and Mfny (Marijuana Farms New York) have shown upward trends, with Jaunty climbing to the third position by March 2025. Despite the competitive pressure, Head & Heal's sales have shown resilience, particularly with a rebound in March 2025, indicating potential for regaining its top position if it continues to leverage its brand strengths effectively.

Notable Products
In March 2025, the Max Strength THC Tincture (1000mg THC, 30ml) reclaimed its position as the top-performing product for Head & Heal, with sales reaching 1536 units. The CBD/THC/CBN 2:1:2 Sleep Tincture (600mg CBD, 300mg THC, 600mg CBN, 30ml) maintained its steady ranking at second place, continuing its strong performance from previous months. The CBD/THC 2:1 Relief Tincture (600mg CBD, 300mg THC, 30ml) held its consistent third place ranking, showing stable sales figures. The CBG/THC 4:1 Focus Tincture (600mg CBG, 150mg THC, 30ml, 1oz) also remained in fourth place, with a slight increase in sales compared to February. Notably, the CBD Muscle & Joint Heat Relief Spray-On (300mg CBD) made its debut in the rankings at fifth place, indicating a promising start.
Top Selling Cannabis Brands
Data for this report comes from real-time sales reporting by participating cannabis retailers via their point-of-sale systems, which are linked up with Headset’s business intelligence software. Headset’s data is very reliable, as it comes digitally direct from our partner retailers. However, the potential does exist for misreporting in the instance of duplicates, incorrectly classified products, inaccurate entry of products into point-of-sale systems, or even simple human error at the point of purchase. Thus, there is a slight margin of error to consider. Brands listed on this page are ranked in the top twenty within the market and product category by total retail sales volume.

