Mar-2025
Sales
Trend
6-Month
Product Count
SKUs
Overview
Market Insights Snapshot
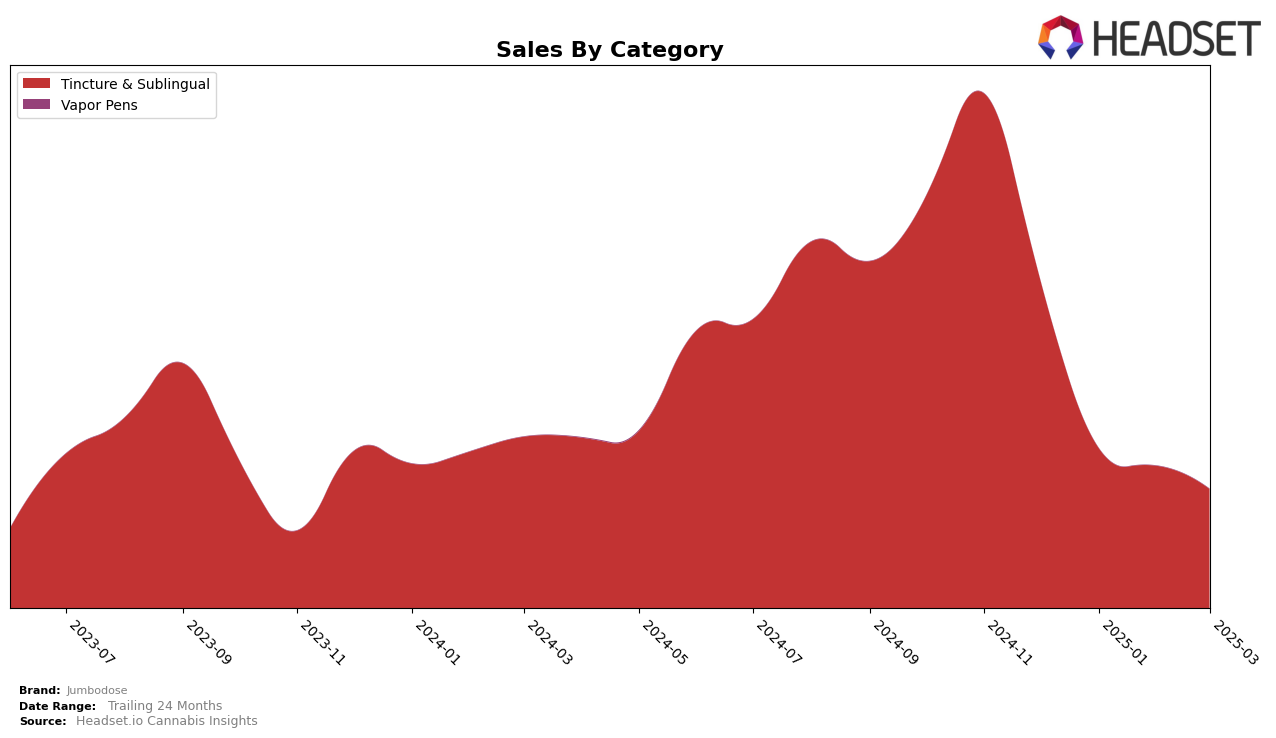
Jumbodose has shown a noticeable shift in its performance within the Tincture & Sublingual category in New York. Starting from December 2024, the brand held a strong position at rank 3, but subsequently experienced a gradual decline, moving to rank 4 in February 2025 and further to rank 5 by March 2025. This downward trend in rankings is mirrored by a consistent decrease in monthly sales figures, with March 2025 sales at $62,902, a significant drop from December's $173,083. The continuous decline in both rank and sales might suggest increasing competition or changes in consumer preferences within this specific category in New York.
Interestingly, Jumbodose's absence from the top 30 brands in other states and categories could be seen as a potential area for growth or a challenge to overcome. The brand's strong presence in the New York Tincture & Sublingual category contrasts with its lack of visibility in other markets, which might indicate a strategic focus or limitation in distribution. Understanding the dynamics behind these rankings and sales movements could provide deeper insights into Jumbodose's market strategy and its adaptability to different regional demands and category preferences.
Competitive Landscape
In the competitive landscape of the Tincture & Sublingual category in New York, Jumbodose has experienced a notable decline in both rank and sales over the past few months. Starting from a strong position in December 2024 with a rank of 3, Jumbodose has gradually slipped to 5th place by March 2025. This decline in rank is mirrored by a significant drop in sales, which have decreased consistently over the same period. In contrast, Jaunty has shown a steady improvement, climbing from 4th to 3rd place, with sales figures surpassing Jumbodose and continuing to grow. Meanwhile, Mfny (Marijuana Farms New York) has also gained traction, moving up to 4th place by March 2025. The competitive pressure from these brands highlights the need for Jumbodose to reassess its strategies to regain its former standing and sales momentum in the New York market.

Notable Products
In March 2025, the top-performing product from Jumbodose was the Hybrid Mega Tincture (1000mg THC, 30ml,1oz) in the Tincture & Sublingual category, maintaining its first-place rank from February with sales of 290 units. The CBD/THC 5:1 Chill Tincture (1500mg CBD, 300mg THC, 30ml) climbed to the second position, showing a consistent performance after being ranked first in January and third in February. The CBN/THC 5:1 Doze Tincture (1500mg CBN, 300mg THC, 30ml) improved its ranking to third, up from fifth in February. The CBG/THC 5:1 Focus Tincture (1500mg CBG, 300mg THC, 30ml) slipped to fourth place, a slight drop from its second-place ranking in February. Lastly, the Rosin Drops Hash Tincture (300mg THC, 30ml) remained steady in the fifth position, consistent with its rank in February.
Top Selling Cannabis Brands
Data for this report comes from real-time sales reporting by participating cannabis retailers via their point-of-sale systems, which are linked up with Headset’s business intelligence software. Headset’s data is very reliable, as it comes digitally direct from our partner retailers. However, the potential does exist for misreporting in the instance of duplicates, incorrectly classified products, inaccurate entry of products into point-of-sale systems, or even simple human error at the point of purchase. Thus, there is a slight margin of error to consider. Brands listed on this page are ranked in the top twenty within the market and product category by total retail sales volume.

