Mar-2025
Sales
Trend
6-Month
Product Count
SKUs
Overview
Market Insights Snapshot
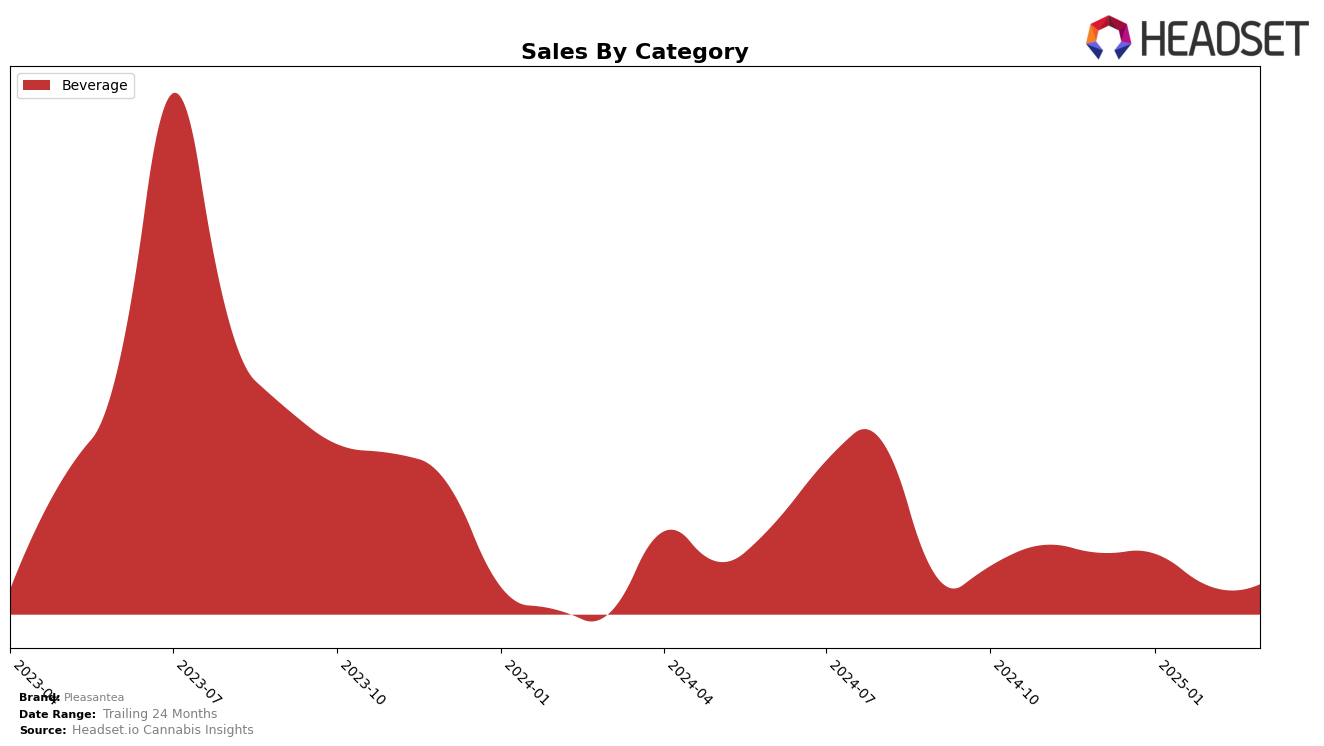
Pleasantea's performance in the beverage category within the state of Michigan has shown a consistent presence in the top ranks, although with some fluctuations. Starting from December 2024, Pleasantea held the 7th position, improved slightly to 6th in January 2025, then slipped back to 7th in February, and further down to 8th by March. This movement indicates a slight decline in their ranking over the months, which could suggest increasing competition or a shift in consumer preferences. Notably, Pleasantea has maintained its position within the top 10, showcasing its ability to stay relevant in a competitive market.
Despite the fluctuations in rankings, Pleasantea's sales figures in Michigan reflect a relatively stable performance, with only minor variations. While the sales dipped from December to February, there was a slight recovery in March. The fact that Pleasantea remains in the top 10 across these months implies a strong brand presence and customer loyalty. However, the absence of Pleasantea in the top 30 brands in other states or provinces might indicate limited market penetration beyond Michigan, which could be an area of potential growth or a strategic decision to focus on this specific market.
Competitive Landscape
In the competitive landscape of the Michigan cannabis beverage market, Pleasantea has experienced some fluctuations in its ranking over the past few months, indicating a dynamic market environment. Starting from December 2024, Pleasantea was ranked 7th, and despite a slight improvement to 6th in January 2025, it returned to 7th in February and slipped to 8th by March. This suggests a competitive pressure from brands like Northern Connections, which climbed from 6th to 3rd before dropping to 7th, and CQ (Cannabis Quencher), which maintained a strong presence in the top ranks. Despite these challenges, Pleasantea's sales have remained relatively stable, although slightly lower than some of its competitors, indicating a need for strategic marketing efforts to regain and improve its market position. Meanwhile, Ray's Lemonade maintained a consistent 8th rank, showing that Pleasantea's position is closely contested. These insights highlight the importance of adapting to market trends and consumer preferences to enhance Pleasantea's competitive edge.

Notable Products
In March 2025, the top-performing product for Pleasantea was Lemon Iced Tea (10mg) in the Beverage category, maintaining its first-place rank from the previous months with sales of 3765 units. Raspberry Iced Tea (10mg) held steady in second place, showing consistent performance across the months. Raspberry Iced Tea (30mg) climbed to third place from its previous fifth-place position in January, demonstrating a positive trend in sales. Peach Iced Tea (10mg) remained in fourth place, while Peach Iced Tea (30mg) continued to rank fifth, despite a slight increase in sales. Overall, the rankings for March 2025 reflect a stable pattern in consumer preferences for Pleasantea's iced tea products.
Top Selling Cannabis Brands
Data for this report comes from real-time sales reporting by participating cannabis retailers via their point-of-sale systems, which are linked up with Headset’s business intelligence software. Headset’s data is very reliable, as it comes digitally direct from our partner retailers. However, the potential does exist for misreporting in the instance of duplicates, incorrectly classified products, inaccurate entry of products into point-of-sale systems, or even simple human error at the point of purchase. Thus, there is a slight margin of error to consider. Brands listed on this page are ranked in the top twenty within the market and product category by total retail sales volume.

