May-2024
Sales
Trend
6-Month
Product Count
SKUs
Overview
Market Insights Snapshot
THC Wellness has shown notable performance in the Tincture & Sublingual category across several states. In Arizona, the brand has consistently held strong positions, maintaining a rank of 4th from February to April 2024, and improving to 3rd in May 2024. This upward movement in Arizona indicates a growing preference for THC Wellness products among consumers in the state. However, it is important to note that the brand did not appear in the top 30 rankings for other states during these months, which suggests that their market penetration is currently limited outside of Arizona. This could be an area for potential growth and strategic focus for the brand.
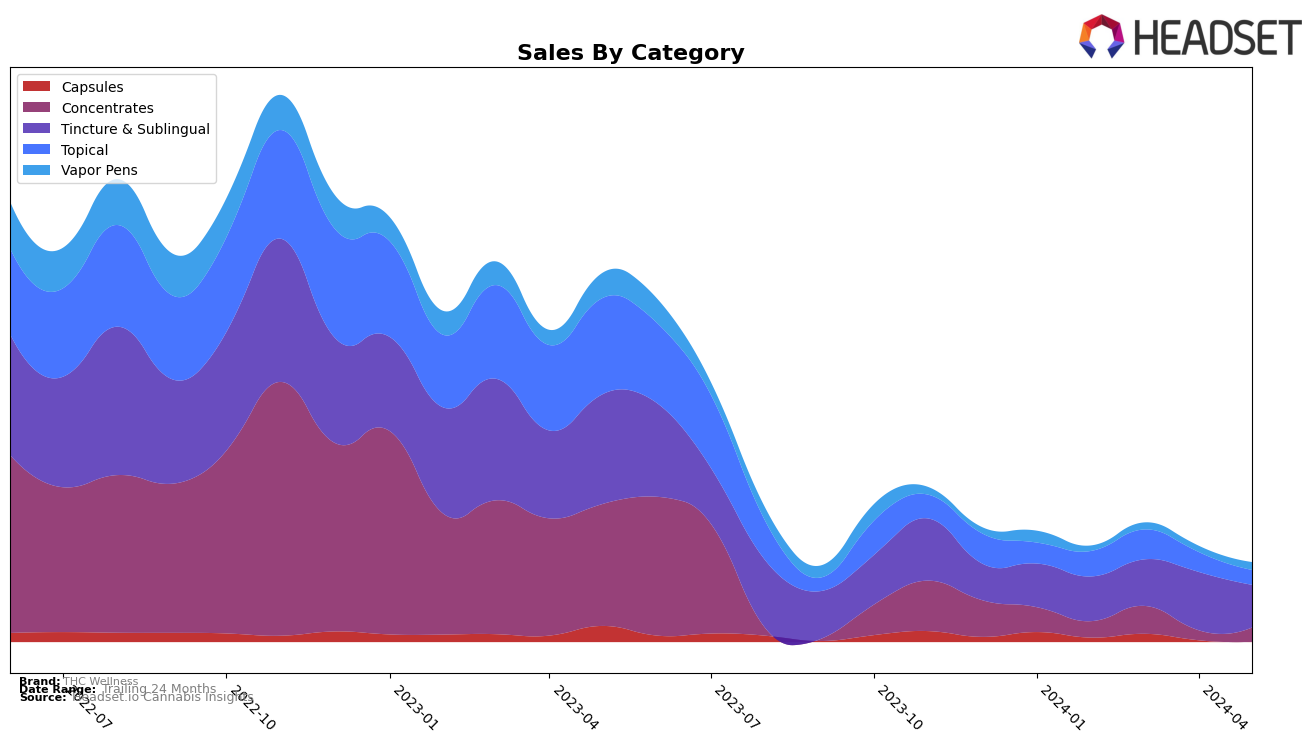
Examining the sales trends, THC Wellness experienced a significant fluctuation in Arizona. From February to April 2024, sales increased from $11,962 to $15,637, reflecting a positive growth trajectory. However, May 2024 saw a decline to $11,416, which may require further analysis to understand the underlying causes. Despite this dip, the brand's improved ranking in May suggests that it was able to outperform competitors even with reduced sales. This resilience highlights THC Wellness's strong market position in Arizona, but the brand's absence from the top 30 in other states underscores the need for expanded market strategies to achieve broader recognition and sales growth.
Competitive Landscape
In the competitive landscape of the Tincture & Sublingual category in Arizona, THC Wellness has shown a notable shift in its market position over the past few months. While maintaining a consistent rank of 4th place from February to April 2024, THC Wellness experienced a positive change by climbing to 3rd place in May 2024. This upward movement is significant given the competitive pressure from brands like CBD Wellness, which saw a decline from 2nd to 4th place, and Chronic Health, which improved its rank to 2nd place in May. The market leader, Drip Oils + Extracts, has consistently held the top position, indicating a strong market presence. The sales trends suggest that while THC Wellness has seen fluctuations in sales figures, its strategic efforts have enabled it to surpass CBD Wellness in the latest month, signaling potential for further growth and increased market share in the near future.

Notable Products
In May-2024, the top-performing product for THC Wellness was the CBD/THC 1:1 Liniment Spray (50mg CBD, 50mg THC, 2oz) with sales of 115 units. The CBD/THC 1:1 RSO Syringe (1g) ranked second, maintaining a strong position from the previous months. The Topical Cream (100mg THC, 1.5oz) dropped to third place from its consistent first-place ranking in February and March. Both the CBD/THC 1:1 Tincture (800mg CBD, 800mg THC, 30ml) and the Natural THC Rich Tincture (1500mg, 30ml) were introduced in May and tied for fourth place. Overall, the rankings saw some significant shifts, particularly with the Topical Cream's decline in position.
Top Selling Cannabis Brands
Data for this report comes from real-time sales reporting by participating cannabis retailers via their point-of-sale systems, which are linked up with Headset’s business intelligence software. Headset’s data is very reliable, as it comes digitally direct from our partner retailers. However, the potential does exist for misreporting in the instance of duplicates, incorrectly classified products, inaccurate entry of products into point-of-sale systems, or even simple human error at the point of purchase. Thus, there is a slight margin of error to consider. Brands listed on this page are ranked in the top twenty within the market and product category by total retail sales volume.


