Sep-2024
Sales
Trend
6-Month
Product Count
SKUs
Overview
Market Insights Snapshot
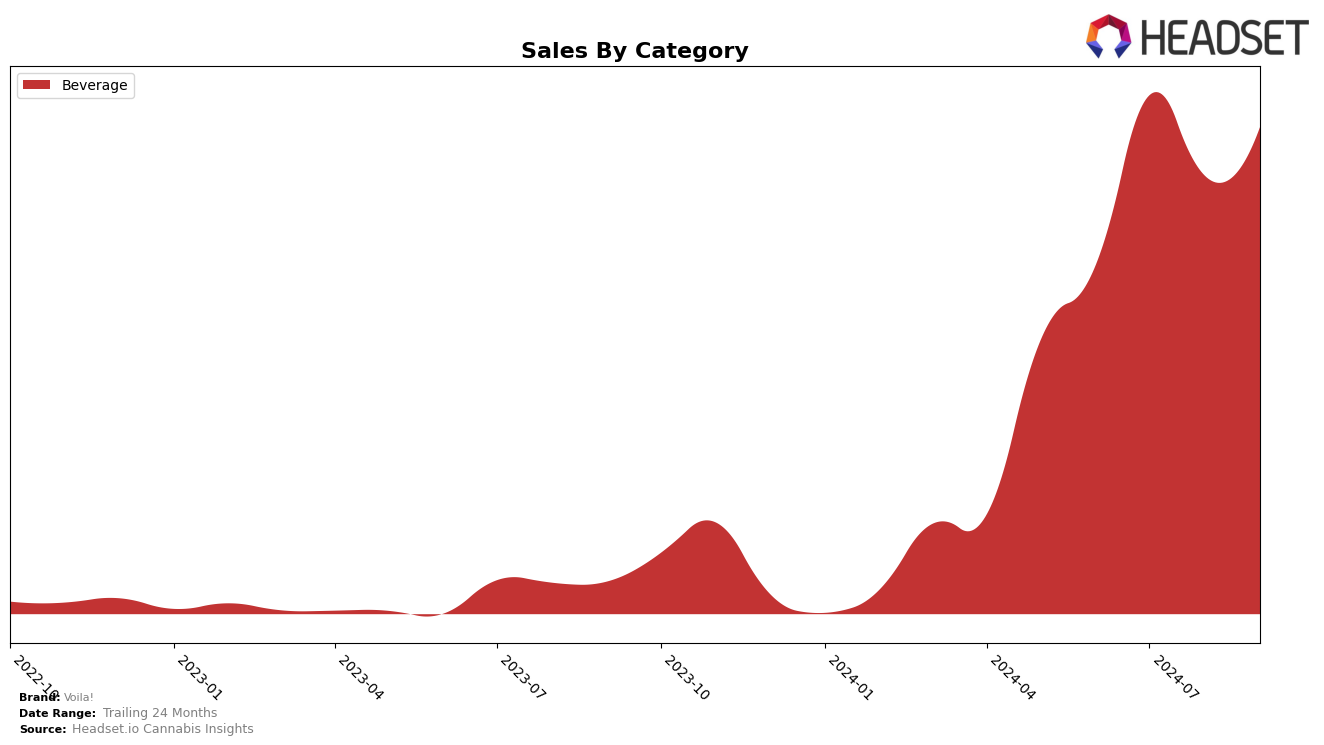
Voila! has shown a promising upward trajectory in the beverage category within Ontario. Starting from a rank of 32 in June, the brand has consistently climbed the rankings, reaching the 27th position by September. This steady improvement indicates a growing acceptance and possibly an expanding market presence in this region. The sales figures reflect a positive trend as well, with a noticeable increase from June to July, despite a slight dip in August. Such movements suggest that Voila! is effectively navigating the competitive landscape in Ontario’s beverage sector.
However, it is noteworthy that Voila! was not within the top 30 brands in the beginning of the observed period, which highlights room for growth and the potential for further market penetration. The absence from the top 30 in June could be seen as a challenge they have managed to overcome, as evidenced by their entry and subsequent rise in the rankings. This performance in Ontario could serve as a strategic model for Voila! to replicate in other states or provinces, where they might be looking to strengthen their market position. The brand's ability to improve its standing over a few months demonstrates adaptability and potential for future advancements.
Competitive Landscape
In the competitive landscape of the beverage category in Ontario, Voila! has shown a promising upward trajectory in its rank over the past few months. Starting from a rank of 32 in June 2024, Voila! has climbed to 27 by September 2024, indicating a positive trend in market presence and consumer acceptance. This improvement in rank is noteworthy, especially when compared to competitors like Ace Valley and Sense & Purpose Beverages, both of which have experienced a decline in their ranks during the same period. Hover Beverages and Embody have maintained relatively stable positions, with Hover Beverages slightly dropping from 25 to 26, and Embody improving from 27 to 25. Despite Voila!'s lower sales figures compared to these competitors, the consistent improvement in rank suggests a growing brand recognition and potential for increased market share. This trend highlights Voila!'s strategic efforts in capturing consumer interest and suggests a promising outlook for future sales growth in the Ontario beverage market.

Notable Products
In September 2024, the top-performing product for Voila! was the CBD:THC 1:1 Pineapple Strawberry Sparkling Water, maintaining its consistent first-place ranking from previous months with notable sales of 1122 units. The CBD:THC 1:1 Watermelon Cannabis Infused Sparkling Water held its ground in second place, although its sales figures saw a decrease compared to August. The CBD/THC 1:1 Cucumber Mint Sparkling Water ranked third, dropping from its second position in August, indicating fluctuating consumer preferences. The CBD/THC 1:2 Peach Pear Sparking Water maintained its fourth-place ranking, consistent with the previous two months. Finally, the CBD/THC 1:2 Watermelon Sparking Water, despite being absent from the July ranking, secured the fifth position in September, showing a slight improvement in sales.
Top Selling Cannabis Brands
Data for this report comes from real-time sales reporting by participating cannabis retailers via their point-of-sale systems, which are linked up with Headset’s business intelligence software. Headset’s data is very reliable, as it comes digitally direct from our partner retailers. However, the potential does exist for misreporting in the instance of duplicates, incorrectly classified products, inaccurate entry of products into point-of-sale systems, or even simple human error at the point of purchase. Thus, there is a slight margin of error to consider. Brands listed on this page are ranked in the top twenty within the market and product category by total retail sales volume.

