Jun-2026
Sales
Trend
6-Month
Product Count
SKUs
Avg Price
YoY Sales Change
YoY Price Change
Market Insights Snapshot
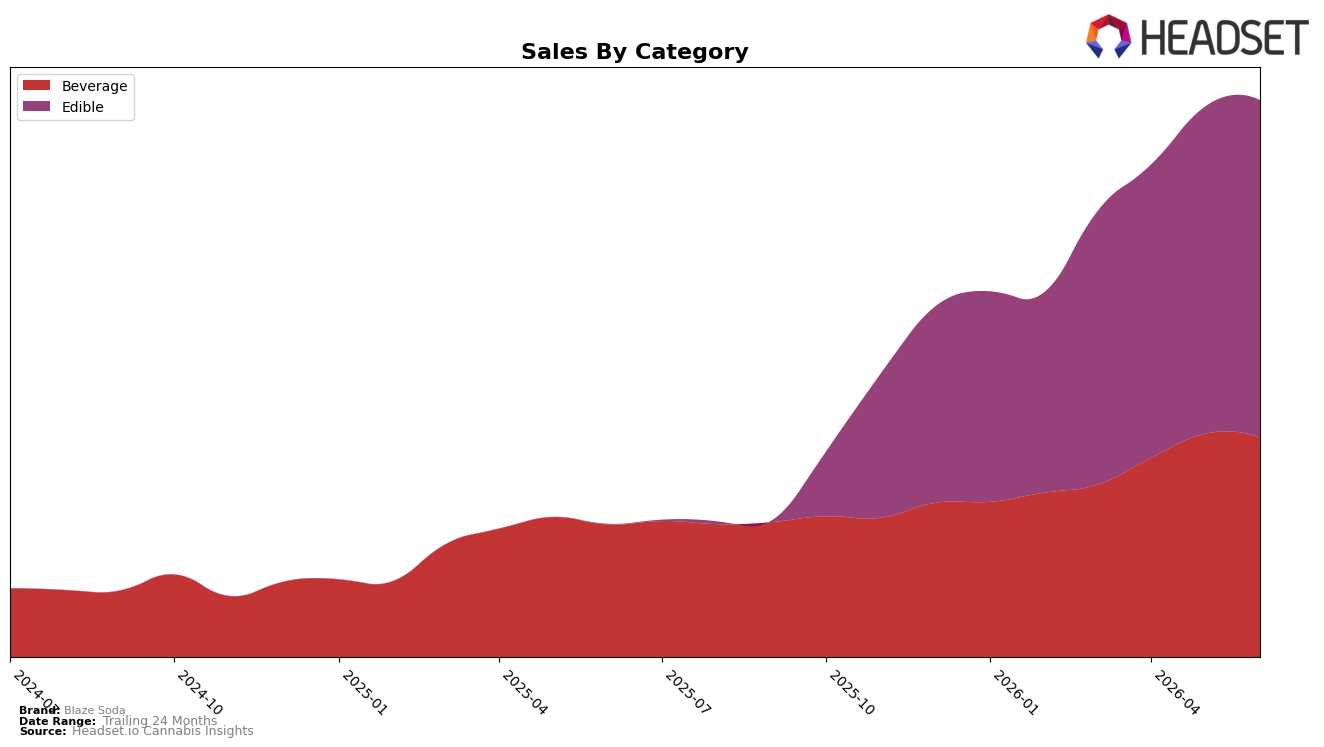
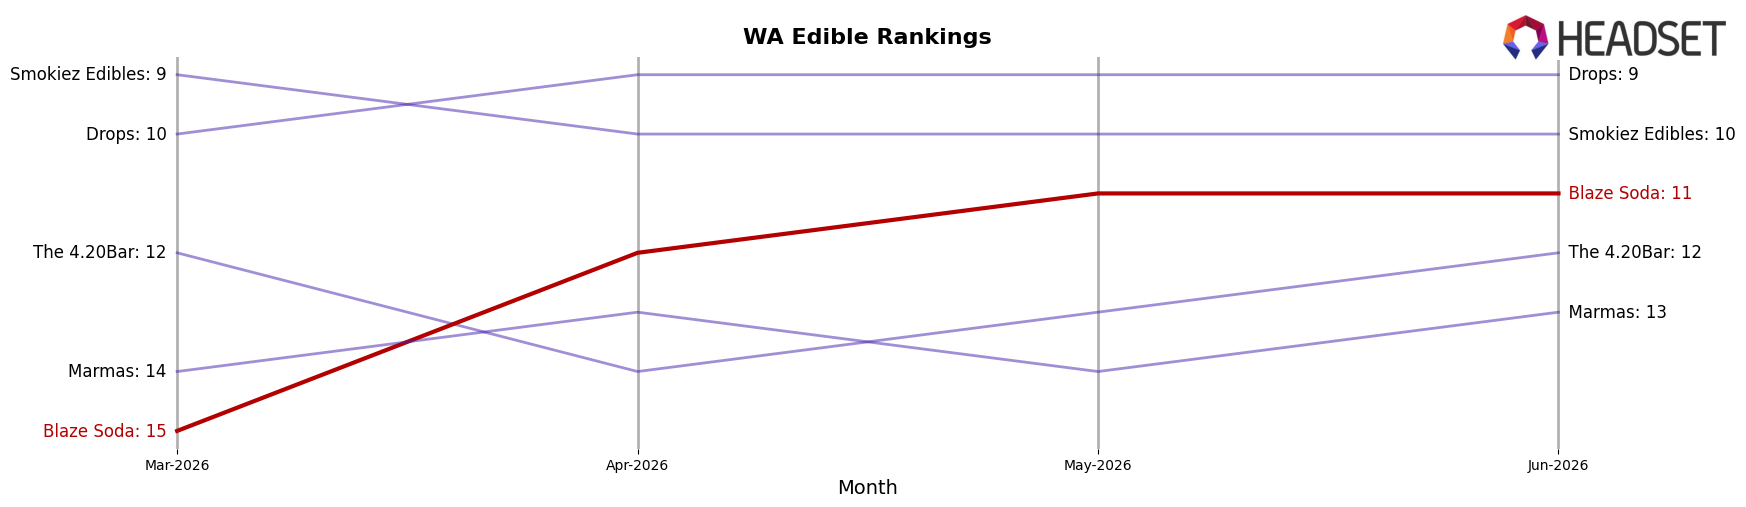
Blaze Soda’s mix in June 2026 tilted toward Edible at 60.53% share while Beverage held 39.47%, with Edible up 104,878.35% year over year and 3.17% month over month versus Beverage up 65.67% year over year and down 1.55% month over month; that split coincided with a 35.27% YoY average price increase alongside a modest monthly volume cadence implied by the 3.17% vs. -1.55% momentum. Within Washington Edible, Blaze Soda sits at rank 11, and the brand’s overall June 2026 sales grew 318.70% year over year while the 24‑month change reached 813.76%, which together point to a portfolio pivot where Edible growth is carrying mix and Beverage is acting as a stabilizer despite a negative MoM. The pattern implies Blaze Soda is migrating demand into higher-priced Edible formats while Beverage growth normalizes, setting up a category-led strategy anchored by Edible share gains.
The shift toward Edible—now a 60.53% anchor with rank 11 in Washington—paired with Beverage’s 39.47% share and a -1.55% MoM suggests Blaze Soda is trading up consumers into premiumized use cases while allowing Beverage to absorb seasonal dips; this trade-up is reinforced by a 35.27% YoY average price climb alongside a 318.70% YoY brand sales expansion. With Edible advancing 3.17% MoM as Beverage contracts 1.55% MoM, the brand’s positioning leans into Edible-led visibility and price resilience, implying merchandising and innovation should prioritize Edible to improve rank from 11 while Beverage serves as a reach vehicle where YoY demand at 65.67% remains accretive but less momentum-rich than Edible’s 104,878.35% surge.
Competitive Landscape
Blaze Soda sits at rank #11 in WA Edible in June 2026 after a year-over-year climb of 76 positions from #87, while also improving 4 spots versus March 2026 from #15 to #11; this matches its peak rank in June 2026, indicating a sharp upward re-entry into the competitive set. In contrast, Wyld held steady at #1 year over year with a 7.3% sales increase, and Green Revolution remained at #2 with a 17.5% sales lift, whereas Hot Sugar stayed at #3 despite a 1.8% sales decline; the juxtaposition of Blaze Soda’s 76-rank YoY ascent and competitors’ static ranks implies Blaze Soda is gaining distribution or velocity faster than incumbents, positioning it to challenge for a top-10 slot if the trajectory persists.
Notable Products
Relief - CBD/CBG/CBC/THC 1:1:1:1 POG + Lion's Mane Gummies 10-Pack (100mg CBD, 100mg CBG, 100mg CBC, 100mg THC) posted the largest month-over-month surge at +133% to rank 1, while Baja Blaze Tropical Lime Rosin Soda (100mg THC, 12oz, 355ml) fell -12% to rank 8. Orange Cream Pie Soda (100mg THC, 6oz) jumped +1,010% to rank 2, yet the Beverage group also saw a -2% dip for POG Distillate Soda (100mg THC, 6oz, 177ml) at rank 5, indicating volatility concentrated at the very top. Four of the top ten are Edible SKUs, including Sleep and Relief sub-lines that slipped -4% at rank 3 and -7% at rank 4 alongside a -8% move at rank 6, implying that Edibles hold share leadership but ceded momentum to a breakout Beverage. The mix implies Blaze Soda is pivoting toward high-velocity novelty in Beverages while leaning on a broad Edibles base for rank density, suggesting promotion or flavor news is reshaping demand faster than core functional formats can recover.
Top Selling Cannabis Brands
Data for this report comes from real-time sales reporting by participating cannabis retailers via their point-of-sale systems, which are linked up with Headset’s business intelligence software. Headset’s data is very reliable, as it comes digitally direct from our partner retailers. However, the potential does exist for misreporting in the instance of duplicates, incorrectly classified products, inaccurate entry of products into point-of-sale systems, or even simple human error at the point of purchase. Thus, there is a slight margin of error to consider. Brands listed on this page are ranked in the top twenty within the market and product category by total retail sales volume.

