.svg)

Aug-2026
Sales
Trend
6-Month
Product Count
SKUs
Avg Price
YoY Sales Change
YoY Price Change


Where to Buy
Buzzy is stocked at 199 licensed dispensaries across Massachusetts and Maine, 133 of them in Massachusetts, with the deepest coverage in Boston, Worcester, Lowell, Springfield, and Dracut. Search by ZIP code or city below to find the closest one, or filter by product type if you are after a specific format.
Market Insights Snapshot
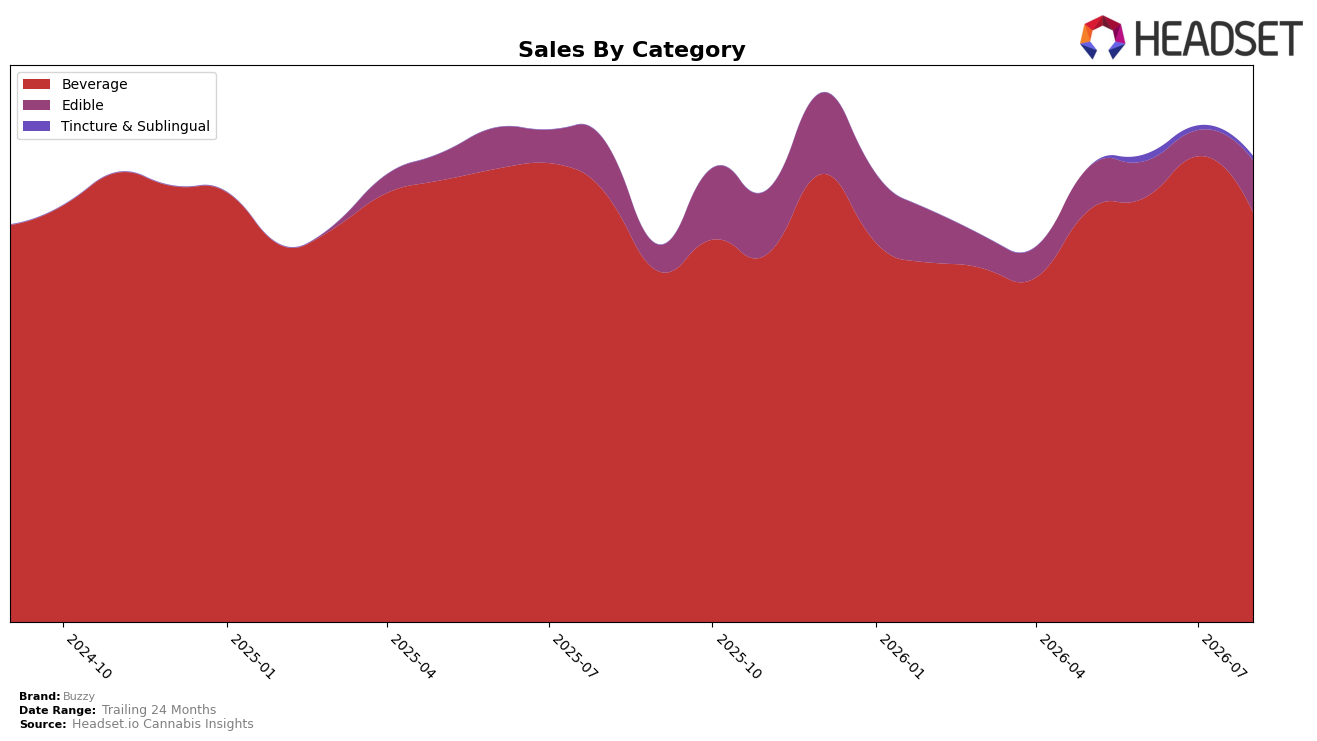
Buzzy concentrated 87.97% of August 2026 sales in Beverage, down 12.10% month over month and 4.90% year over year, while Edible climbed to an 11.18% share on a 101.53% MoM surge and a 1.60% YoY gain; Tincture & Sublingual held 0.84% share with a 7.92% MoM decline and no YoY baseline. Despite a 0.93% YoY rise in average price to $6.32, overall brand sales fell 3.39% YoY and 5.05% over 24 months, implying mix-driven drag from Beverage contraction outweighing pricing support.
Within Beverage, Buzzy sits at rank 3 in Massachusetts, yet the 12.10% MoM drop alongside Edible’s 101.53% MoM expansion and 1.60% YoY growth signals reliance on a softening core while an adjacent category gains traction; this mix shift implies headroom to defend the Beverage position while reallocating toward Edible to stabilize the 3.39% YoY sales decline. The combination of an 87.97% Beverage share and an 11.18% Edible share suggests concentration risk, and the divergent trends indicate that maintaining rank 3 requires buffering Beverage volatility with targeted Edible growth where price points are higher and category momentum is positive.
Competitive Landscape
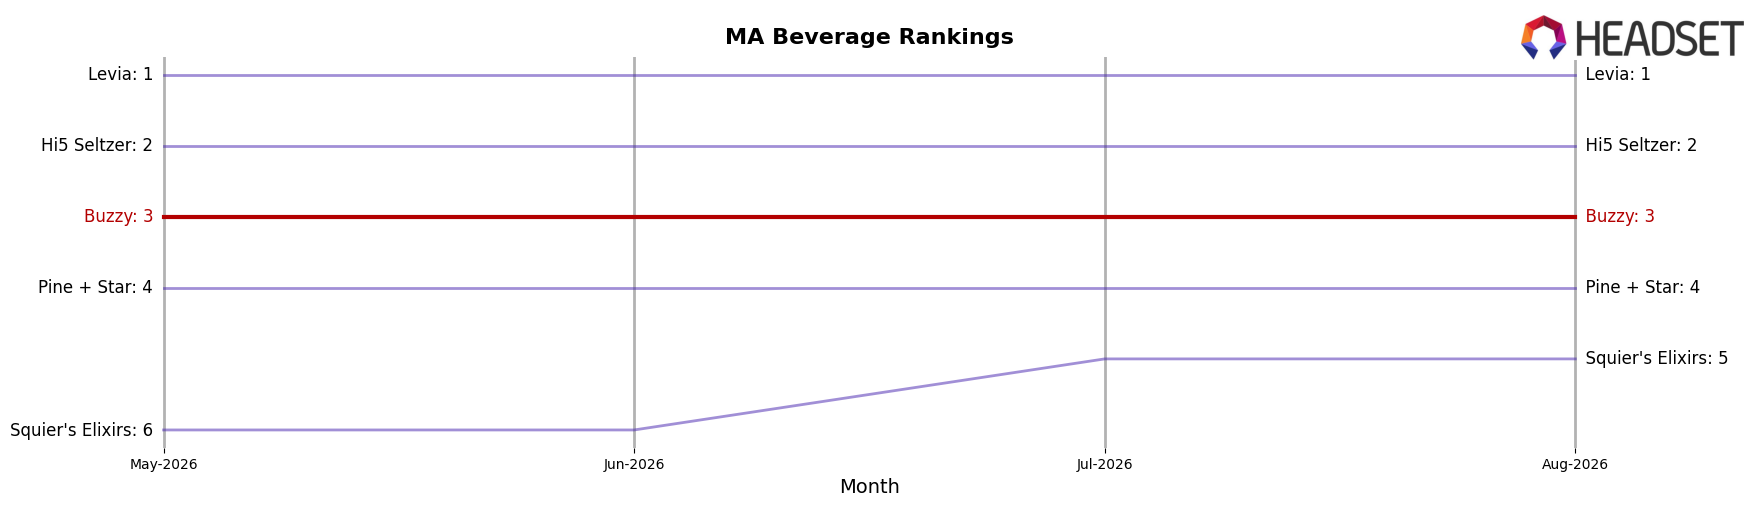
Buzzy is currently ranked #3 in MA Beverage in August 2026, unchanged from #3 year over year, and also holding #3 over the latest three months, indicating zero rank mobility while the category reordered around it; meanwhile, Levia held #1 with a 6.0% YoY sales increase and Hi5 Seltzer stayed #2 with 23.6% YoY growth, whereas Pine + Star advanced from #5 to #4 and Squier's Elixirs climbed from #7 to #5 with 29.4% YoY growth; the pattern implies Buzzy’s flat rank at its peak of #3 in August 2026 is being maintained more by a stable competitive gap than by relative acceleration, so without a share or velocity shift its position risks future erosion as faster-rising competitors compress the space above and below.
Notable Products
Ginger Ale Soda (5mg THC, 355ml, 12oz) posted the steepest decline in August 2026 at -37.3% MoM while holding rank 8, outpacing the drops in Buzz Mountain Caffeinated Soda at -21.7% (rank 7) and Cola Zero Sugar Soda at -20.2% (rank 10). At the top, Root Beer Soda slipped -11.4% yet remained rank 1, whereas Orange Soda was flat at +0.1% and stayed rank 2, and four of the top ten are Seltzer SKUs despite THC/CBN 1:1 Blissful Berry Seltzer falling -12.0% at rank 4. The largest stable contributor remains Root Beer Soda at $27,221 even as THC/CBD 1:1 Tropical Kush Seltzer declined -16.2% at rank 6, which contrasts with Grape Soda’s +2.8% at rank 3. The pattern implies carbonated legacy flavors are anchoring share while functional and niche profiles retrench, signaling a tilt toward classic sodas over wellness-oriented seltzers in near-term assortment and promo planning.
Top Selling Cannabis Brands






Data for this report comes from real-time sales reporting by participating cannabis retailers via their point-of-sale systems, which are linked up with Headset’s business intelligence software. Headset’s data is very reliable, as it comes digitally direct from our partner retailers. However, the potential does exist for misreporting in the instance of duplicates, incorrectly classified products, inaccurate entry of products into point-of-sale systems, or even simple human error at the point of purchase. Thus, there is a slight margin of error to consider. Brands listed on this page are ranked in the top twenty within the market and product category by total retail sales volume.

