Oct-2024
Sales
Trend
6-Month
Product Count
SKUs
Overview
Market Insights Snapshot
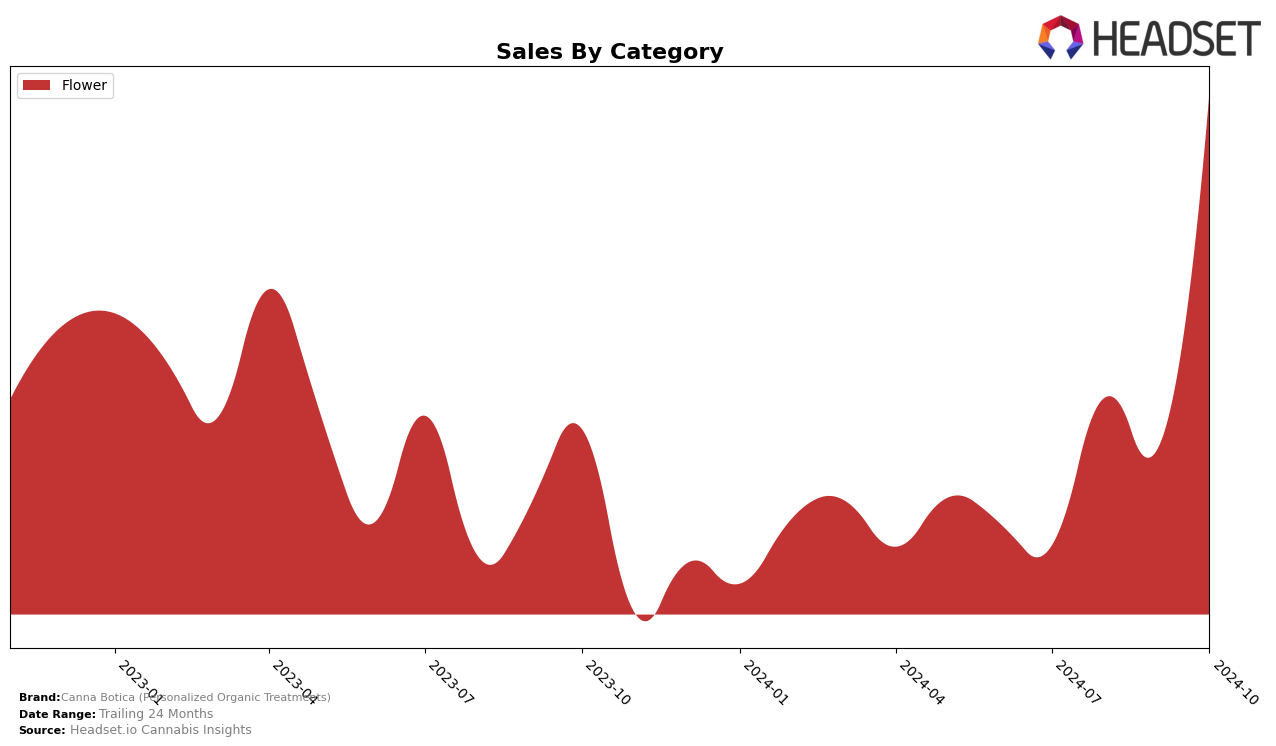
Canna Botica (Personalized Organic Treatments) has experienced a notable upward trajectory in the Colorado market, particularly within the Flower category. Starting from a rank of 59 in July 2024, the brand improved its position to 44 in August, and while there was a slight dip to 45 in September, it surged to 29 by October. This significant improvement in rankings correlates with a substantial increase in sales, indicating a strengthening presence in the market. The brand's ability to break into the top 30 by October is a positive indicator of its growing consumer base and effective market strategies.
However, it's important to note that Canna Botica did not make it into the top 30 brands in any other state or category during this period. This absence could be seen as a potential area for growth, suggesting that while the brand is gaining traction in Colorado, there is still considerable opportunity to expand its footprint in other regions and categories. The data suggests that focusing on replicating their Colorado success strategy could be beneficial in achieving broader market penetration. This selective success highlights the importance of market-specific strategies and suggests a need for tailored approaches in other states to achieve similar growth.
Competitive Landscape
In the competitive landscape of the Colorado flower category, Canna Botica (Personalized Organic Treatments) has shown a remarkable upward trajectory in rankings over the past few months. Starting from a rank of 59 in July 2024, the brand has climbed to 29 by October 2024, indicating a significant improvement in market presence and consumer preference. This upward movement is noteworthy, especially when compared to competitors like Bloom County, which fell from 19 to 33 in the same period, and Vera, which fluctuated but ended at rank 30. Meanwhile, Higher Function and Hi-Fuel have maintained relatively stable positions, with ranks of 28 and 27 respectively in October. Canna Botica's sales have also seen a positive trend, particularly in October, where they surpassed those of Vera and closely approached Higher Function's figures, suggesting a growing consumer base and potential for further market share gains in the coming months.

Notable Products
In October 2024, Runtz (Bulk) from Canna Botica (Personalized Organic Treatments) maintained its top position in the Flower category, with an impressive sales figure of 1,456 units. Galactic Punch (Bulk) climbed to the second position, showing a significant increase in sales from 432 units in September to 899 units in October. Original Glue #4 (Bulk) dropped slightly to the third rank, although it experienced a modest rise in sales compared to the previous month. OG Kush (1g) made its way to the fourth position, improving from its fifth rank in August. L.A OG (Bulk) re-entered the rankings at fifth place, marking its presence after not being ranked in the previous months.
Top Selling Cannabis Brands
Data for this report comes from real-time sales reporting by participating cannabis retailers via their point-of-sale systems, which are linked up with Headset’s business intelligence software. Headset’s data is very reliable, as it comes digitally direct from our partner retailers. However, the potential does exist for misreporting in the instance of duplicates, incorrectly classified products, inaccurate entry of products into point-of-sale systems, or even simple human error at the point of purchase. Thus, there is a slight margin of error to consider. Brands listed on this page are ranked in the top twenty within the market and product category by total retail sales volume.


