Jan-2025
Sales
Trend
6-Month
Product Count
SKUs
Overview
Market Insights Snapshot
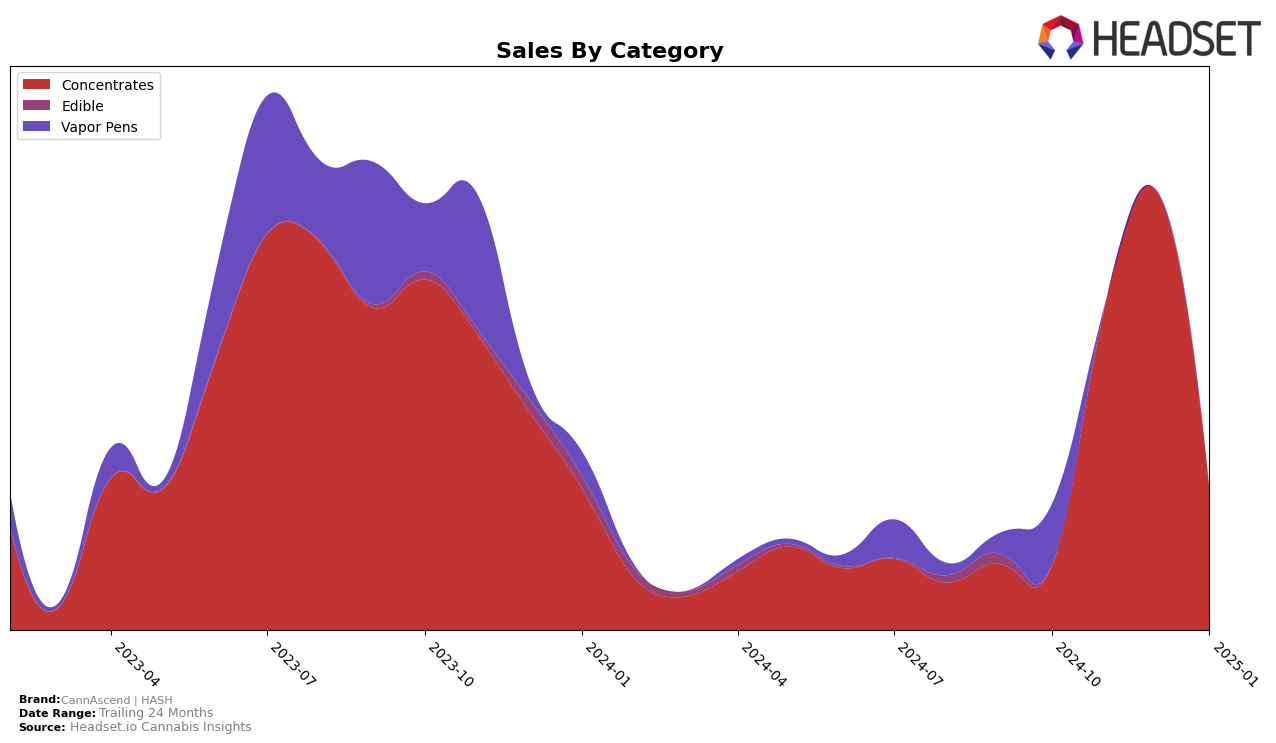
The performance of CannAscend | HASH in the Concentrates category has shown significant fluctuations across the months in Ohio. In October 2024, the brand did not make it into the top 30, but by November, it surged to 15th place, indicating a substantial improvement in market presence. This upward trend continued in December 2024, where CannAscend | HASH climbed to 12th place, showcasing its growing popularity among consumers. However, January 2025 saw a slight decline as the brand slipped to 18th place, suggesting a potential need for strategic adjustments to maintain its competitive edge.
While the brand demonstrated impressive growth in sales, particularly from October to December 2024, with a peak in December, the drop in January 2025 highlights the volatile nature of the cannabis market. The absence of a ranking in the top 30 in October 2024 could be seen as a challenge the brand overcame quickly, but the subsequent decline in January suggests a need for sustained marketing efforts or product innovation to retain consumer interest. The dynamic shifts in rankings across these months underline the importance of adaptability and responsiveness to market trends for brands like CannAscend | HASH.
Competitive Landscape
In the Ohio concentrates market, CannAscend | HASH has shown a dynamic performance with significant fluctuations in rank and sales over the observed months. Starting from a rank of 31 in October 2024, the brand made a remarkable leap to 15 in November and further improved to 12 in December, before slightly dropping to 18 in January 2025. This trajectory indicates a strong competitive presence, especially when compared to brands like Main Street Health, which hovered around the 20th rank, and HZ, which consistently maintained a mid-range position. CannAscend | HASH's sales surged dramatically from October to December, reflecting a growing consumer preference, although there was a notable dip in January. This fluctuation in sales and rank highlights the brand's potential to capture market share, especially as it competes against Firelands Scientific and Holistic and Spiritual Health (HASH), which have shown varying performances with Firelands re-entering the top 20 in January. The data suggests that while CannAscend | HASH has demonstrated strong growth, maintaining this momentum will be crucial in the face of such competitive dynamics.

Notable Products
In January 2025, the top-performing product from CannAscend | HASH was Propane Badder (1g) in the Concentrates category, which ascended to the number one rank with notable sales of 283 units. Aloha Lion Live Resin Badder (1g) followed as the second-ranked product, making its debut on the list. South Side Legend Badder (1g) slipped to third place from its previous second-place position in December 2024, with a significant drop in sales to 91 units. Aloha Lion Badder (1g) ranked fourth, having fallen from its second position in December. Notably, MAC1 Badder (1g), which was ranked third in November 2024, did not make the top rankings in January 2025.
Top Selling Cannabis Brands
Data for this report comes from real-time sales reporting by participating cannabis retailers via their point-of-sale systems, which are linked up with Headset’s business intelligence software. Headset’s data is very reliable, as it comes digitally direct from our partner retailers. However, the potential does exist for misreporting in the instance of duplicates, incorrectly classified products, inaccurate entry of products into point-of-sale systems, or even simple human error at the point of purchase. Thus, there is a slight margin of error to consider. Brands listed on this page are ranked in the top twenty within the market and product category by total retail sales volume.

