Jan-2025
Sales
Trend
6-Month
Product Count
SKUs
Overview
Market Insights Snapshot
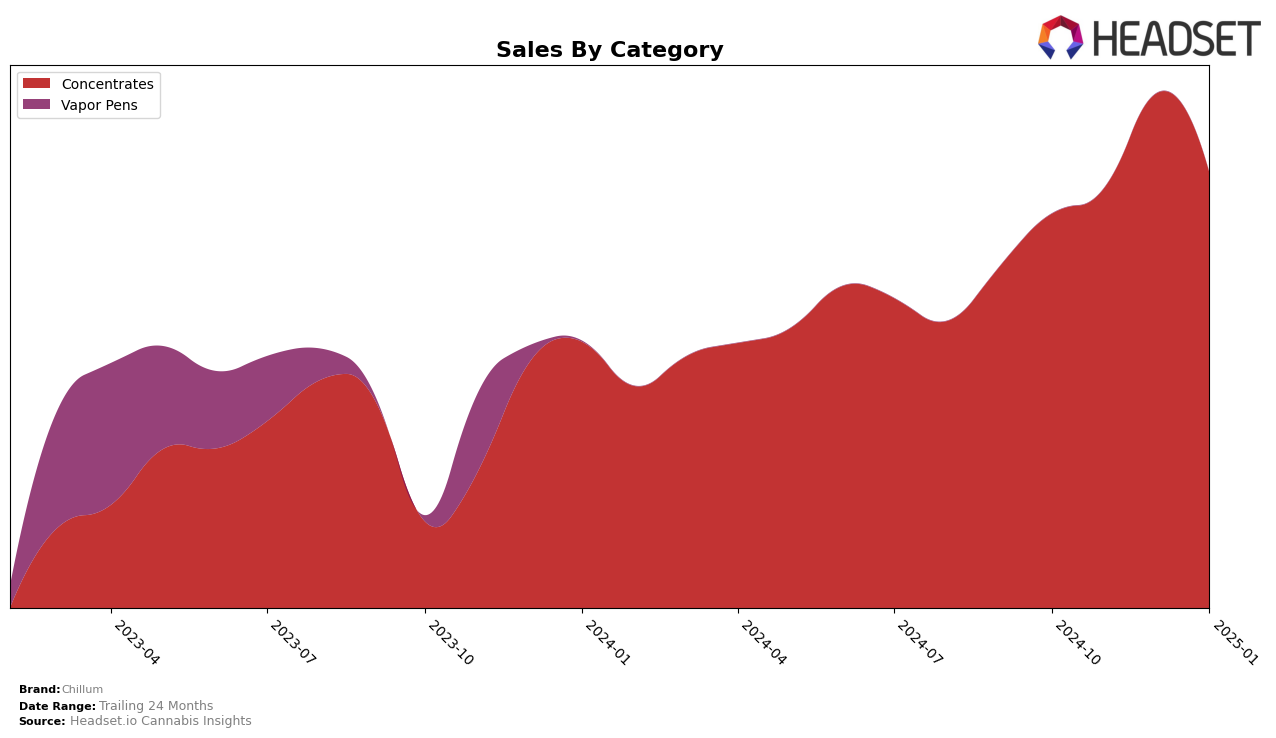
Chillum has shown a notable presence in the concentrates category within Ontario. Over the last few months, the brand has consistently climbed the rankings, moving from 29th place in October 2024 to 25th place by December, before slightly dropping to 27th in January 2025. This fluctuation suggests a competitive market where Chillum is managing to maintain a foothold, albeit with some challenges. The increase in sales from October to December, followed by a slight decline in January, indicates a potential seasonal trend or market dynamics that could be influencing consumer preferences. The fact that Chillum remains within the top 30 brands in Ontario's concentrates category is a positive sign of its market stability and consumer appeal.
While Chillum's performance in Ontario is notable, the absence of ranking data for other states or provinces suggests that the brand may not yet have a significant presence outside of this region. This could highlight opportunities for expansion or areas where the brand is currently focusing its efforts. The lack of rankings in other markets could be viewed as a challenge for Chillum, indicating potential gaps in market penetration or brand recognition. However, the upward trend in sales within Ontario could provide a strong foundation for future growth and expansion strategies in other regions. Overall, Chillum's performance in Ontario's concentrates category reflects a brand with a growing presence and the potential for broader market engagement.
Competitive Landscape
In the Ontario concentrates market, Chillum has shown a promising upward trend in rankings over the past few months, moving from 29th in October 2024 to 25th in December 2024, before slightly dipping to 27th in January 2025. This improvement in rank is mirrored by a significant increase in sales, particularly notable in December 2024, where Chillum's sales peaked. In comparison, Kolab and HASHCO have experienced fluctuating ranks, with Kolab consistently ranking lower than Chillum by January 2025, despite a sales boost in December. Meanwhile, Sauce Rosin Labs remains a strong competitor, maintaining a higher rank than Chillum throughout the period, although its sales saw a decline in January 2025. Polar, while improving its rank over time, still trails behind Chillum, indicating Chillum's competitive edge in the market. These dynamics suggest that Chillum's strategic initiatives might be effectively capturing consumer interest, positioning it well against its competitors in the Ontario concentrates category.

Notable Products
In January 2025, Black Hash (3.5g) from Chillum maintained its position as the top-selling product in the Concentrates category, with sales reaching 2098 units. This product has consistently held the number one rank since October 2024, demonstrating its strong market presence. Other products from Chillum have shown slight fluctuations in their rankings, but none have surpassed Black Hash (3.5g) in terms of sales volume. Compared to previous months, the sales figures for Black Hash (3.5g) have slightly decreased from December 2024 but remain robust. This consistent performance highlights the product's ongoing popularity among consumers.
Top Selling Cannabis Brands
Data for this report comes from real-time sales reporting by participating cannabis retailers via their point-of-sale systems, which are linked up with Headset’s business intelligence software. Headset’s data is very reliable, as it comes digitally direct from our partner retailers. However, the potential does exist for misreporting in the instance of duplicates, incorrectly classified products, inaccurate entry of products into point-of-sale systems, or even simple human error at the point of purchase. Thus, there is a slight margin of error to consider. Brands listed on this page are ranked in the top twenty within the market and product category by total retail sales volume.

