Jan-2025
Sales
Trend
6-Month
Product Count
SKUs
Overview
Market Insights Snapshot
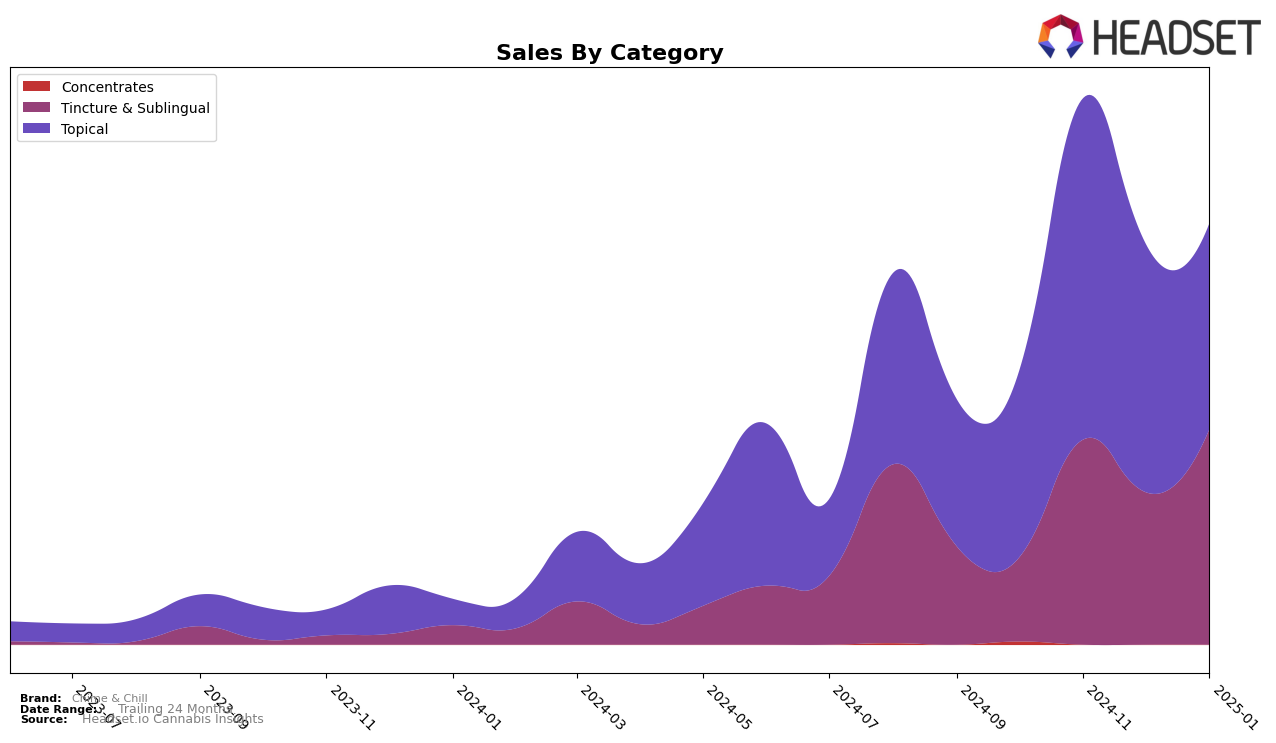
Chime & Chill has shown a mixed performance across its product categories in New York. In the Tincture & Sublingual category, the brand achieved a notable rank of 8th in November 2024, but it was absent from the top 30 in both October 2024 and December 2024, before reappearing at 11th in January 2025. This fluctuation suggests a volatile presence in this category, possibly influenced by seasonal demand or competitive dynamics. The ranking absence in certain months indicates a potential area for improvement or a need for strategic adjustments to maintain consistent visibility in the market.
Conversely, in the Topical category, Chime & Chill has maintained a steady and strong position, consistently ranking 3rd from October 2024 through January 2025. This stability highlights the brand's solid foothold and consumer preference in this category in New York. Despite a minor dip in sales from November to January, the brand's consistent ranking suggests a loyal customer base and effective product differentiation. Such sustained performance in the Topical category could serve as a model for improving its standing in other categories. This consistency is a strong indicator of brand reliability and market fit, which could be leveraged for strategic growth in less stable categories.
Competitive Landscape
In the competitive landscape of the Tincture & Sublingual category in New York, Chime & Chill has shown fluctuating performance, with its rank absent in October and December 2024, but appearing at 8th in November 2024 and dropping to 11th by January 2025. This indicates a volatile market presence compared to competitors like High Falls Canna New York, which maintained a more stable ranking, albeit with a gradual decline from 5th to 9th over the same period. Meanwhile, Canna Clinicals consistently held a stronger position, improving from 7th to 8th, with significant sales growth, suggesting a robust market strategy that Chime & Chill might need to analyze for potential improvements. The absence of Harney Brothers Cannabis from the rankings after October 2024 highlights the competitive pressure in this segment, emphasizing the need for Chime & Chill to enhance its market strategies to secure a more consistent and higher ranking.

Notable Products
In January 2025, the top-performing product from Chime & Chill was the CBD/CBN 2:1 PM Lotion (300mg CBD, 150mg CBN) in the Topical category, maintaining its number one rank consistently since October 2024, with sales figures reaching 239 units. The CBD Tincture K.O. Double Dose (4500mg CBD, 30ml) in the Tincture & Sublingual category rose to second place, showing a marked improvement from its fifth position in October 2024. The CBD/CBG 2:1 AM Cream (300mg CBD, 150mg CBG) fell to third place, having held the second position in the previous months. The CBD/CBN 2:1 PM Oral Solution 10-Pack (200mg CBD, 100mg CBN) maintained its fourth position for two consecutive months. A new entry, the CBD/CBG AM Recover & Replenish Bath Salts (100mg CBD, 100mg CBG), entered the rankings in fifth place, indicating a promising start.
Top Selling Cannabis Brands
Data for this report comes from real-time sales reporting by participating cannabis retailers via their point-of-sale systems, which are linked up with Headset’s business intelligence software. Headset’s data is very reliable, as it comes digitally direct from our partner retailers. However, the potential does exist for misreporting in the instance of duplicates, incorrectly classified products, inaccurate entry of products into point-of-sale systems, or even simple human error at the point of purchase. Thus, there is a slight margin of error to consider. Brands listed on this page are ranked in the top twenty within the market and product category by total retail sales volume.

