Aug-2024
Sales
Trend
6-Month
Product Count
SKUs
Overview
Market Insights Snapshot
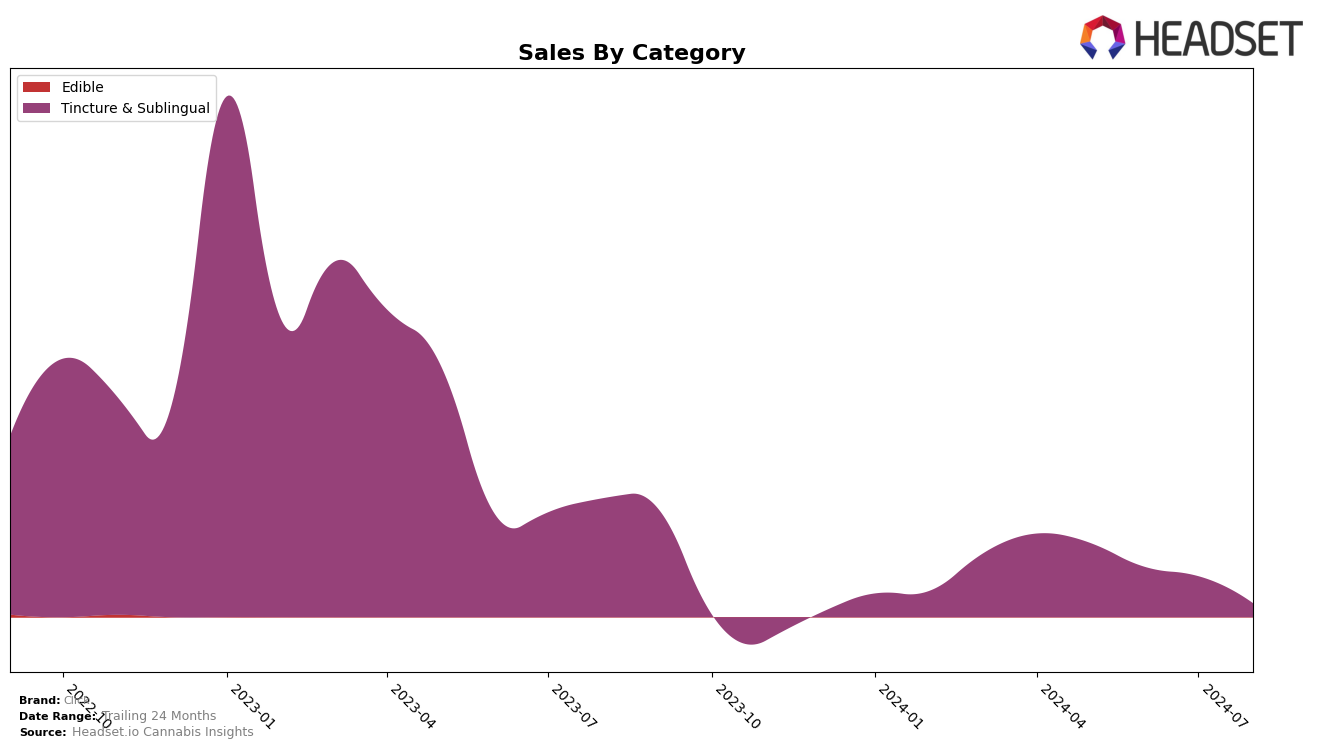
Click has shown a notable performance in the Ohio market, particularly within the Tincture & Sublingual category. In May 2024, Click achieved a commendable 9th place ranking, which stands out as a significant achievement given the competitive landscape. However, the brand did not maintain its position in the subsequent months, as it fell out of the top 30 rankings in June, July, and August. This drop indicates a potential challenge in sustaining market presence or could reflect seasonal fluctuations in consumer preferences.
Despite the decline in rankings after May, the initial performance in Ohio suggests that Click has the potential to capture consumer interest in the Tincture & Sublingual category. The brand's ability to secure a top 10 spot in such a competitive market underscores its appeal, even though it faced difficulties in maintaining that momentum. The absence from the top 30 in the following months might be seen as a setback, but it also highlights areas for potential growth and re-strategizing. Observing these trends can provide valuable insights into market dynamics and consumer behavior, which are crucial for future strategic planning.
Competitive Landscape
In the Ohio Tincture & Sublingual category, Click experienced a notable shift in its competitive standing over the summer of 2024. Starting at rank 9 in May, Click did not maintain a position in the top 20 for the subsequent months, indicating a significant drop in market presence. In contrast, Standard Farms showed a strong upward trajectory, moving from rank 6 in June to rank 3 in July, before settling at rank 7 in August. This consistent presence in the top ranks suggests a robust sales performance, with sales figures peaking at 38,280 in July. Similarly, Tinctible maintained a steady position around the 7th and 8th ranks throughout the same period, with a notable sales increase in August. These trends highlight the competitive pressure on Click, emphasizing the need for strategic adjustments to regain market share in Ohio's Tincture & Sublingual segment.

Notable Products
In August 2024, the top-performing product from Click was the CBD/THC 1:1 Restore Sublingual Spray (110mg CBD, 110mg THC), maintaining its position as the number one product since July 2024, despite a sales figure of 58 units. The Dream - CBD/THC 2:1 Melatonin + Midnight Mint Oral Spray (137.6mg CBD, 62.4mg THC) rose to the second position, showing consistent performance from June and July. The CBD/THC 1:2 Chill Spray (110mg CBD, 220mg THC) ranked fifth in July but did not make it to the top rankings in August. The Chill - CBD/THC 2:1 L-Theanine + TropiCali Oral Spray (66.2mg CBD, 133.8mg THC) was not in the top ranks for August, having dropped from the second position in July. Lastly, the Chill - CBD/THC 2:1 Oral Spray (69.23mg CBD, 127.28mg THC) did not appear in the top ranks for August, continuing its decline from previous months.
Top Selling Cannabis Brands
Data for this report comes from real-time sales reporting by participating cannabis retailers via their point-of-sale systems, which are linked up with Headset’s business intelligence software. Headset’s data is very reliable, as it comes digitally direct from our partner retailers. However, the potential does exist for misreporting in the instance of duplicates, incorrectly classified products, inaccurate entry of products into point-of-sale systems, or even simple human error at the point of purchase. Thus, there is a slight margin of error to consider. Brands listed on this page are ranked in the top twenty within the market and product category by total retail sales volume.

