Jan-2025
Sales
Trend
6-Month
Product Count
SKUs
Overview
Market Insights Snapshot
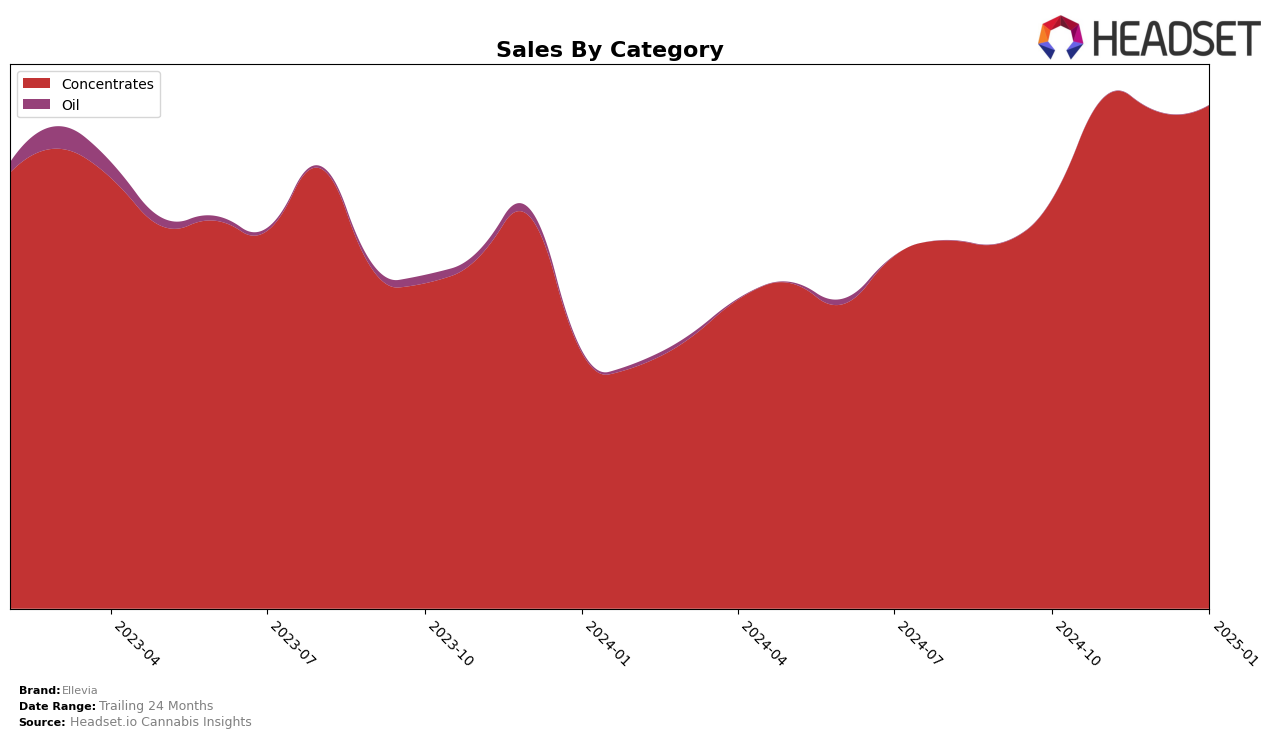
Ellevia's performance in the Concentrates category has shown notable differences across the provinces of Alberta and Ontario. In Alberta, Ellevia struggled to maintain a consistent presence in the top 30 rankings, dipping out of this range in December 2024 before recovering to 36th place in January 2025. This fluctuation in rank highlights challenges in maintaining a competitive edge in Alberta's market. Conversely, in Ontario, Ellevia has demonstrated a more stable performance, consistently improving its position from 27th in October 2024 to 23rd in January 2025. This upward trend suggests a stronger foothold in Ontario's Concentrates market, where Ellevia appears to be gaining traction among consumers.
The sales figures further illustrate Ellevia's varied success across these regions. In Ontario, sales have shown a general upward trend, peaking in December 2024 before slightly declining in January 2025, yet still maintaining a robust position. This sales growth aligns with the brand's improving rank in the province, indicating positive consumer reception. In contrast, Alberta's sales figures reveal a more volatile pattern, with a notable dip in December 2024 that corresponds with their drop in ranking. Despite this, the recovery in January 2025 suggests potential for stabilization, though the brand's absence from the top 30 during December remains a point of concern. These insights underscore the importance of regional strategies tailored to market dynamics for Ellevia's continued growth.
Competitive Landscape
In the Ontario concentrates market, Ellevia has shown a consistent improvement in its rankings, moving from 27th place in October 2024 to 23rd by January 2025. This upward trend suggests a positive reception of their products, potentially driven by strategic marketing or product innovation. In comparison, Purple Hills maintained a strong presence, consistently ranking around 20th, which indicates a stable customer base and possibly a more established brand loyalty. Meanwhile, RAD (Really Awesome Dope) showed fluctuations but ended January 2025 at 21st, slightly ahead of Ellevia, suggesting competitive pressure in the market. Sauce Rosin Labs experienced a decline, dropping to 25th in January 2025, which might indicate challenges in maintaining their market share. Ellevia's sales trajectory, with a peak in December 2024, aligns with its improved ranking, highlighting its potential to capture more market share if it continues on this path.

Notable Products
In January 2025, the top-performing product for Ellevia was RSO Full Spectrum (1g) in the Concentrates category, maintaining its number one rank from the previous months with sales of 1689 units. Following closely, RSO Full Spectrum (4g) secured the second spot consistently since October 2024. RSO Resin (1g) held steady in third place, showing a significant increase in sales from 278 units in December to 404 units in January. Icy Mint RSO (1g) remained in fourth place, with minimal sales growth. Overall, the rankings for these top products have remained unchanged over the past few months, indicating stable consumer preferences within the brand's offerings.
Top Selling Cannabis Brands
Data for this report comes from real-time sales reporting by participating cannabis retailers via their point-of-sale systems, which are linked up with Headset’s business intelligence software. Headset’s data is very reliable, as it comes digitally direct from our partner retailers. However, the potential does exist for misreporting in the instance of duplicates, incorrectly classified products, inaccurate entry of products into point-of-sale systems, or even simple human error at the point of purchase. Thus, there is a slight margin of error to consider. Brands listed on this page are ranked in the top twenty within the market and product category by total retail sales volume.

