Dec-2024
Sales
Trend
6-Month
Product Count
SKUs
Overview
Market Insights Snapshot
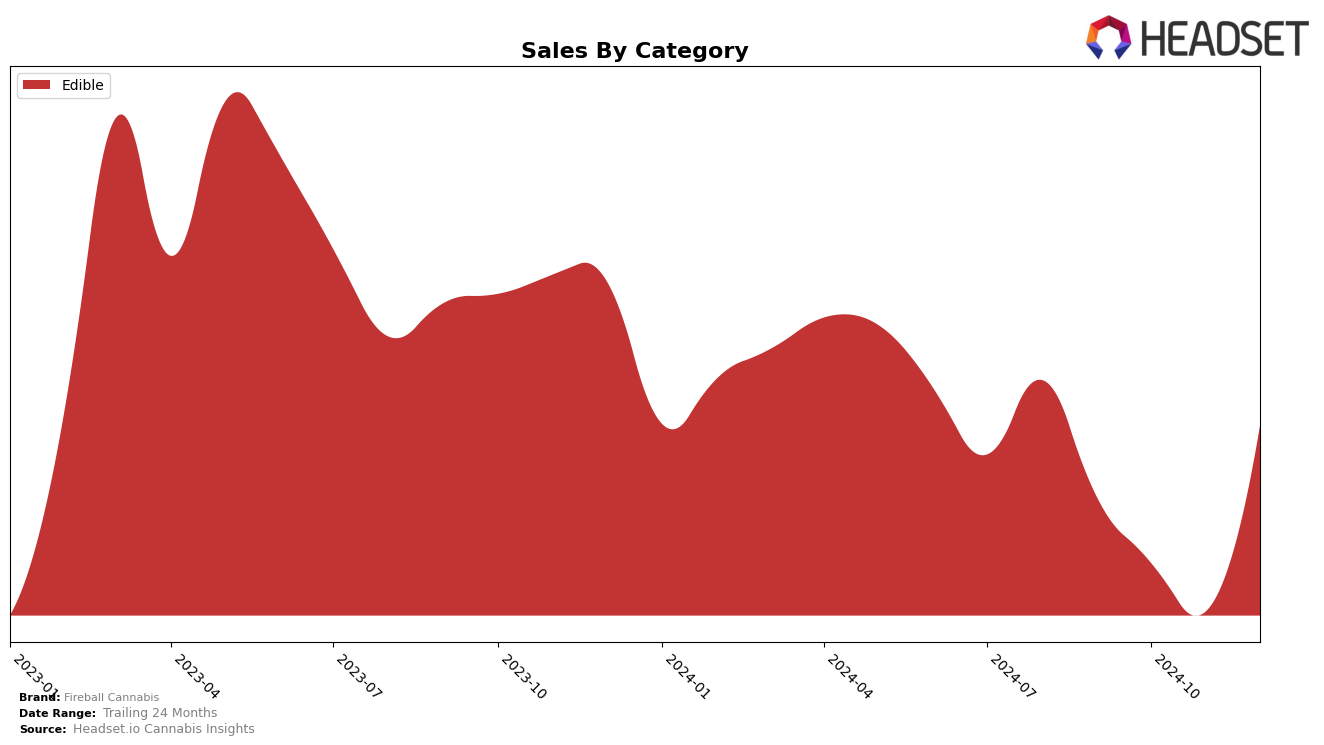
Fireball Cannabis has shown varied performance across different states and categories, with notable movements in their rankings over the past months. In Maryland, the brand's presence in the Edible category has been relatively stable, with a slight improvement from the 27th position in September to the 23rd by December. This upward trend is accompanied by a significant increase in sales, particularly in December, indicating a strong finish to the year. However, the journey hasn't been entirely smooth, as November saw a dip in sales, which could suggest a seasonal or competitive factor impacting their performance that month.
In contrast, Fireball Cannabis faced challenges in Missouri, where the brand struggled to maintain a top 30 position in the Edible category during October and November. Despite starting at the 26th rank in September, they dropped out of the top 30 entirely in the following months, only to reappear at 34th in December. This inconsistency might reflect a highly competitive market or changing consumer preferences in the state. The fluctuation in rankings and sales figures highlights the dynamic nature of the cannabis market and suggests that Fireball Cannabis may need to adapt its strategy to regain a stronger foothold in Missouri.
Competitive Landscape
In the Maryland edible cannabis market, Fireball Cannabis has shown a notable improvement in its rank from September to December 2024, moving from 27th to 23rd place. This upward trajectory indicates a positive reception and growing popularity among consumers. Despite starting off the period outside the top 20, Fireball Cannabis's December sales surpassed those of Beezle Extracts, which saw a decline in rank to 25th. Meanwhile, Garcia Hand Picked maintained a steady 24th rank from October to December, suggesting a stable but less dynamic presence compared to Fireball Cannabis. Sweet Talk and Sunnies by SunMed consistently ranked higher, with Sweet Talk improving from 22nd to 21st and Sunnies by SunMed holding strong at 20th, indicating stronger market positions. These insights suggest that while Fireball Cannabis is gaining traction, it faces stiff competition from well-established brands in the Maryland edibles category.

Notable Products
In December 2024, the top-performing product for Fireball Cannabis was the Sativa Cinnamon Live Resin Gummies 10-Pack (100mg) in the Edible category, maintaining its consistent number one rank from previous months with impressive sales of 3,964 units. The Cinnamon Red Hot Gummies 10-Pack (400mg) held the second position, showing a steady improvement from its third place in November. The Sativa Cinnamon Live Resin Gummies 10-Pack (500mg) climbed back to third place after being unranked in November, indicating a resurgence in popularity. Fireball Gummies 10-Pack (100mg) retained its fourth position, demonstrating stable performance. The Sativa Cinnamon Fruit Chews 20-Pack (100mg) dropped to fifth place from second in November, suggesting a shift in consumer preference within the Edible category.
Top Selling Cannabis Brands
Data for this report comes from real-time sales reporting by participating cannabis retailers via their point-of-sale systems, which are linked up with Headset’s business intelligence software. Headset’s data is very reliable, as it comes digitally direct from our partner retailers. However, the potential does exist for misreporting in the instance of duplicates, incorrectly classified products, inaccurate entry of products into point-of-sale systems, or even simple human error at the point of purchase. Thus, there is a slight margin of error to consider. Brands listed on this page are ranked in the top twenty within the market and product category by total retail sales volume.

