Mar-2025
Sales
Trend
6-Month
Product Count
SKUs
Overview
Market Insights Snapshot
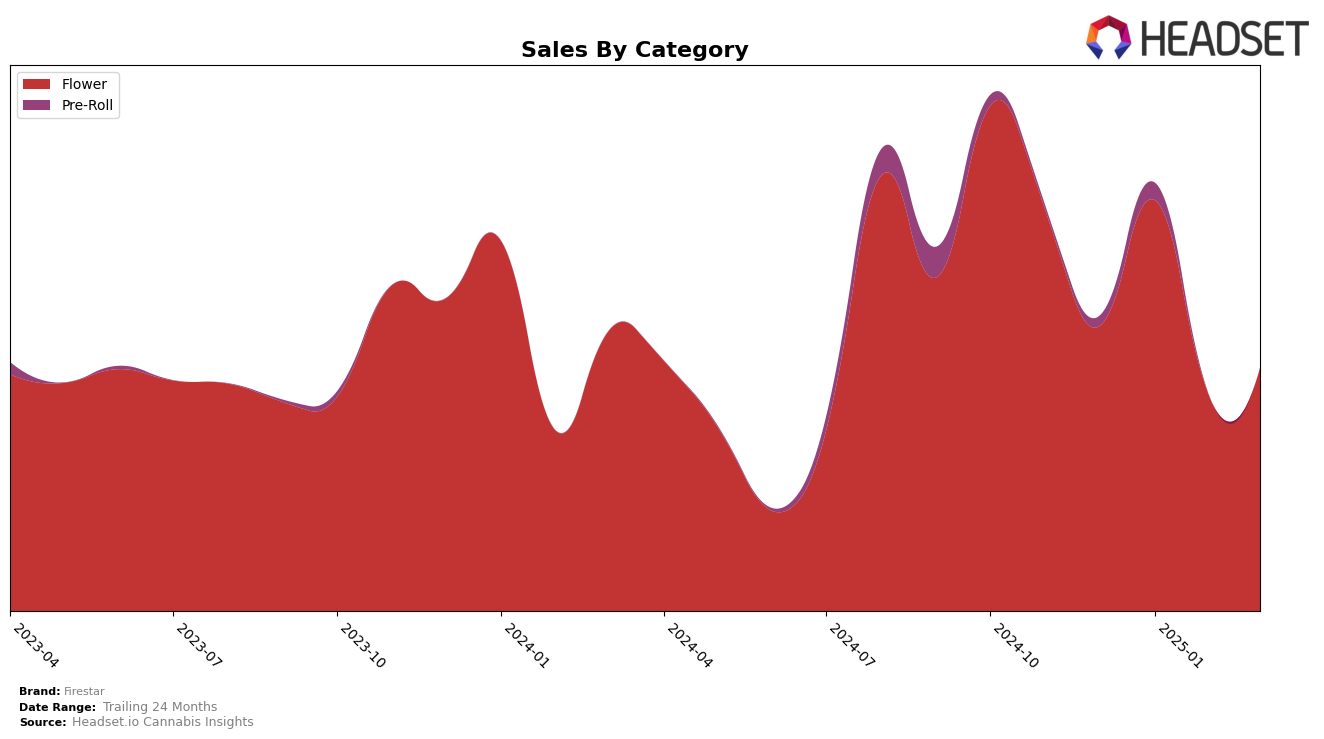
Firestar's performance in the Nevada market showcases a dynamic movement across different cannabis categories. In the Flower category, Firestar experienced a notable fluctuation in rankings, starting at 12th in December 2024, peaking at 10th in January 2025, then dropping to 19th in February, and slightly recovering to 16th by March. This suggests a volatile yet resilient presence in the Flower segment. In terms of sales, January 2025 was a significant month, with sales peaking at $525,516, indicating a strong demand during that period. However, the subsequent decline in February might point to increased competition or seasonal factors affecting sales.
In contrast, Firestar's performance in the Pre-Roll category in Nevada was less prominent, as they did not make it into the top 30 after January 2025. Starting at 55th in December and moving up to 43rd in January, the absence of rankings in the following months indicates a struggle to maintain a competitive edge in this segment. This could be due to several factors, including market saturation or shifts in consumer preferences. The initial upward movement in January, however, suggests there was a temporary boost in popularity, perhaps due to new product launches or promotional efforts that were not sustained in the following months.
Competitive Landscape
In the competitive landscape of the Nevada flower category, Firestar has experienced notable fluctuations in its market position from December 2024 to March 2025. Initially ranked 12th in December, Firestar climbed to 10th in January, only to drop to 19th in February, before recovering slightly to 16th in March. This volatility highlights the dynamic nature of the market, where competitors like Grassroots and Dope Dope have shown more consistent performance, with Grassroots maintaining a top 20 position and Dope Dope improving from 27th to 14th over the same period. Despite Firestar's sales peaking in January, the subsequent decline in February suggests potential challenges in sustaining momentum against these competitors. Meanwhile, Hippies made a significant leap from outside the top 40 to 17th in March, indicating a potential emerging threat. These insights underscore the importance for Firestar to strategize effectively to stabilize its ranking and capitalize on sales opportunities in the competitive Nevada flower market.

Notable Products
In March 2025, Firestar's top-performing product was Fire n Ice (14g) from the Flower category, maintaining its first-place position from February, with notable sales of 1,766 units. Lemon Cherry Gelato #33 (14g) entered the rankings at the second position, indicating a strong debut. Fat Bastard (14g) followed closely as the third-ranked product, while Honey Badger (14g) secured the fourth position. Glitter Bomb (14g), which had previously been ranked second in both December and February, dropped to fifth place in March. This shift in rankings highlights a dynamic change in consumer preferences, with new entries rising and previously popular products experiencing a decline.
Top Selling Cannabis Brands
Data for this report comes from real-time sales reporting by participating cannabis retailers via their point-of-sale systems, which are linked up with Headset’s business intelligence software. Headset’s data is very reliable, as it comes digitally direct from our partner retailers. However, the potential does exist for misreporting in the instance of duplicates, incorrectly classified products, inaccurate entry of products into point-of-sale systems, or even simple human error at the point of purchase. Thus, there is a slight margin of error to consider. Brands listed on this page are ranked in the top twenty within the market and product category by total retail sales volume.

