Mar-2025
Sales
Trend
6-Month
Product Count
SKUs
Overview
Market Insights Snapshot
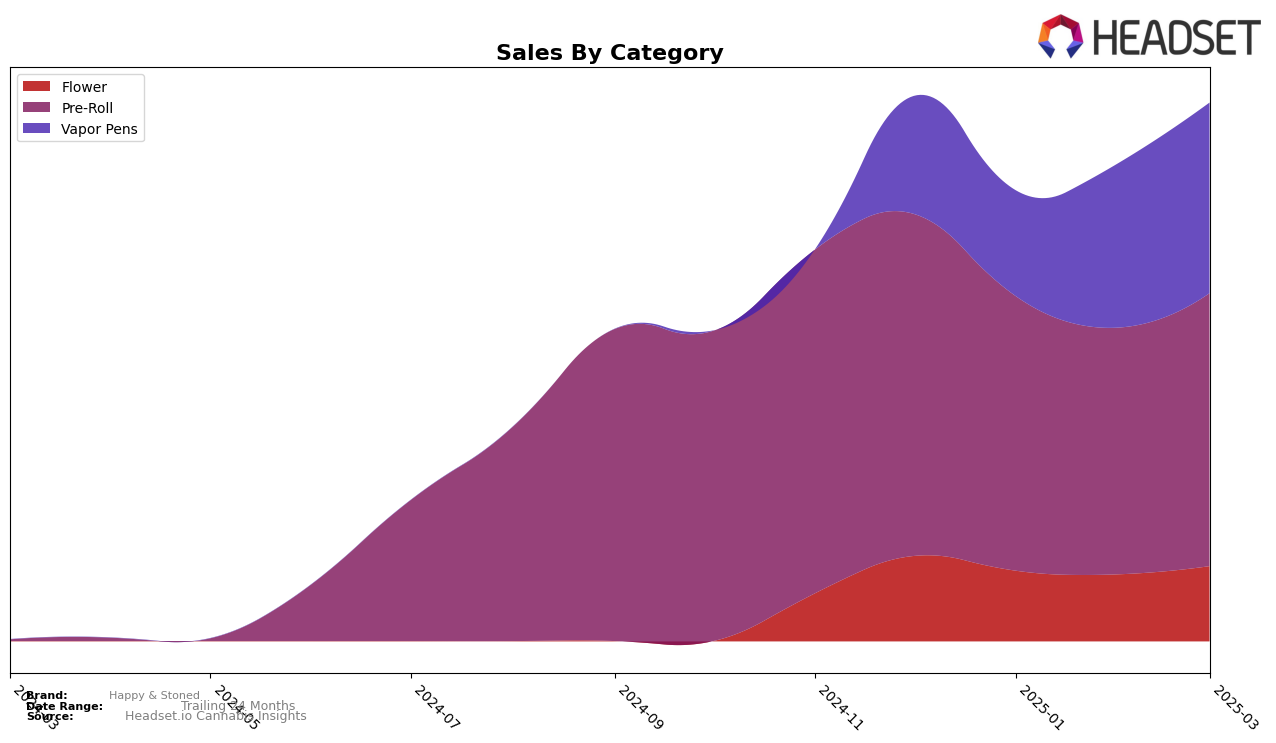
Happy & Stoned has shown varied performance across different categories and regions in recent months. In Ontario, the brand has displayed a consistent upward trend in the Flower category, improving its ranking from 87th in December 2024 to 77th by March 2025. This indicates a strengthening market presence in the province, despite a slight fluctuation in sales figures. Meanwhile, the Pre-Roll category in Ontario has seen a more stable ranking, hovering around the 30s, with a notable increase in sales from February to March 2025. However, in Alberta, the brand's absence from the top 30 in the Pre-Roll category suggests potential challenges in gaining traction in this specific market.
The Vapor Pens category in Ontario has been a bright spot for Happy & Stoned, with a significant climb from 40th to 23rd place between December 2024 and March 2025. This upward movement is accompanied by a notable increase in sales, indicating a growing consumer preference for their products in this category. Conversely, in Saskatchewan, the brand has experienced volatility within the Pre-Roll segment, with rankings fluctuating from 31st to 46th, reflecting potential market challenges or shifts in consumer demand. Understanding these dynamics is crucial for stakeholders aiming to optimize market strategies and capitalize on growth opportunities.
Competitive Landscape
In the competitive landscape of the Pre-Roll category in Ontario, Happy & Stoned has shown a steady improvement in its rankings from December 2024 to March 2025, moving from 36th to 31st place. This upward trend is indicative of a positive shift in consumer preference or effective marketing strategies. Notably, Shatterizer and Sheeesh! have been close competitors, with Shatterizer maintaining a slightly higher rank, though it experienced a decline from 24th to 30th place over the same period. Meanwhile, 1964 Supply Co and OHJA have also been in the mix, with 1964 Supply Co improving its rank from 37th to 29th, surpassing Happy & Stoned in March. Despite the competitive pressure, Happy & Stoned's consistent sales growth and ranking improvement suggest a strengthening market position, potentially driven by product differentiation or enhanced customer engagement strategies.

Notable Products
In March 2025, Happy & Stoned's top-performing product was Slumpz Pre-Roll (1g) in the Pre-Roll category, maintaining its number one rank for four consecutive months despite a decrease in sales to 6,332 units. Juicy Fuel Pre-Roll 2-Pack (2g) also held its second-place position from February, with a notable rise in sales to 5,002 units. Slumpz Milled (3.5g) moved up to third place in the Flower category, climbing one rank from February. Bold Bubba Pop Distillate Diamond Cartridge (1g) improved its rank to fourth in the Vapor Pens category, previously ranked fifth. Juicy Fuel Milled (3.5g) experienced a drop in rank from third to fifth in the Flower category, reflecting a slight decline in sales.
Top Selling Cannabis Brands
Data for this report comes from real-time sales reporting by participating cannabis retailers via their point-of-sale systems, which are linked up with Headset’s business intelligence software. Headset’s data is very reliable, as it comes digitally direct from our partner retailers. However, the potential does exist for misreporting in the instance of duplicates, incorrectly classified products, inaccurate entry of products into point-of-sale systems, or even simple human error at the point of purchase. Thus, there is a slight margin of error to consider. Brands listed on this page are ranked in the top twenty within the market and product category by total retail sales volume.

