Aug-2024
Sales
Trend
6-Month
Product Count
SKUs
Overview
Market Insights Snapshot
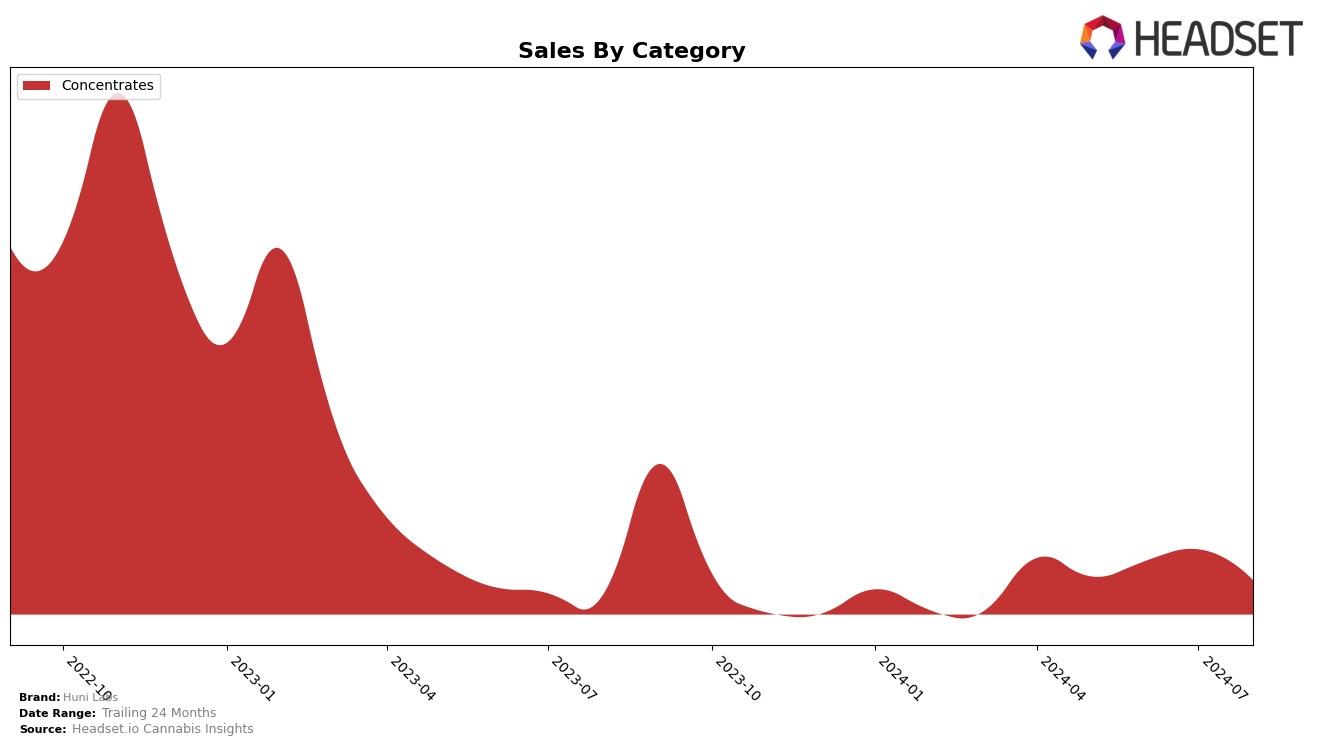
Huni Labs has shown notable fluctuations in performance across different states and categories over recent months. In Nevada, the brand experienced a rise in the Concentrates category, moving from rank 34 in May 2024 to rank 21 in July 2024. However, this upward trend was not sustained as they dropped to rank 26 in August. The increase in rankings during the early summer months indicates a positive reception to their products, but the subsequent decline suggests potential challenges in maintaining market share or competing with other brands.
While Huni Labs managed to secure a position within the top 30 in Nevada for the Concentrates category, their absence from the top 30 in other states and categories is a point of concern. This indicates that Huni Labs may need to reassess their strategies or product offerings to gain a stronger foothold in those markets. The brand's performance in Nevada, despite its fluctuations, provides a mixed but insightful case study on the importance of consistent market presence and competitive positioning.
Competitive Landscape
In the Nevada concentrates market, Huni Labs has shown notable fluctuations in its ranking over the past few months, which could impact its sales trajectory. In May 2024, Huni Labs was ranked 34th, but it improved significantly to 27th in June and further to 21st in July, before dropping to 26th in August. This volatility contrasts with the more stable performance of competitors like Virtue Las Vegas, which consistently remained outside the top 20, and Pure Tonic Concentrates, which hovered around the mid-20s. Notably, Mo-jo (NV) showed a dramatic rise to 9th place in June, although it also experienced a decline to 24th by August. These shifts suggest that while Huni Labs has the potential for upward mobility, it faces stiff competition and market volatility, making it crucial for the brand to leverage advanced data insights to maintain and improve its market position.

Notable Products
In August 2024, the top-performing product for Huni Labs was Leftover Bananas Cured Resin Badder (0.5g) in the Concentrates category, maintaining its first-place ranking from the previous two months with 166 units sold. Wedding Crasher Live Resin Badder (0.95g) rose to second place, up from fourth in July, indicating a notable increase in popularity. Butterscotch Cured Resin Badder (0.5g) dropped to third place from its consistent second place in the prior three months. Orange Sorbet Live Resin Badder (0.95g) held steady in fourth place, showing a slight decline in sales. Runtz Pops Live Resin Badder (0.95g) fell to fifth place from third in July, reflecting a significant drop in sales figures.
Top Selling Cannabis Brands
Data for this report comes from real-time sales reporting by participating cannabis retailers via their point-of-sale systems, which are linked up with Headset’s business intelligence software. Headset’s data is very reliable, as it comes digitally direct from our partner retailers. However, the potential does exist for misreporting in the instance of duplicates, incorrectly classified products, inaccurate entry of products into point-of-sale systems, or even simple human error at the point of purchase. Thus, there is a slight margin of error to consider. Brands listed on this page are ranked in the top twenty within the market and product category by total retail sales volume.

