.svg)
Sep-2026
Sales
Trend
6-Month
Product Count
SKUs
Avg Price
YoY Sales Change
YoY Price Change


Where to Buy
Level is stocked at 717 licensed dispensaries across California, New York, and 6 other states, 437 of them in California, with the deepest coverage in Los Angeles, Sacramento, San Diego, San Francisco, and La Mesa. Search by ZIP code or city below to find the closest one, or filter by product type if you are after a specific format.
Market Insights Snapshot
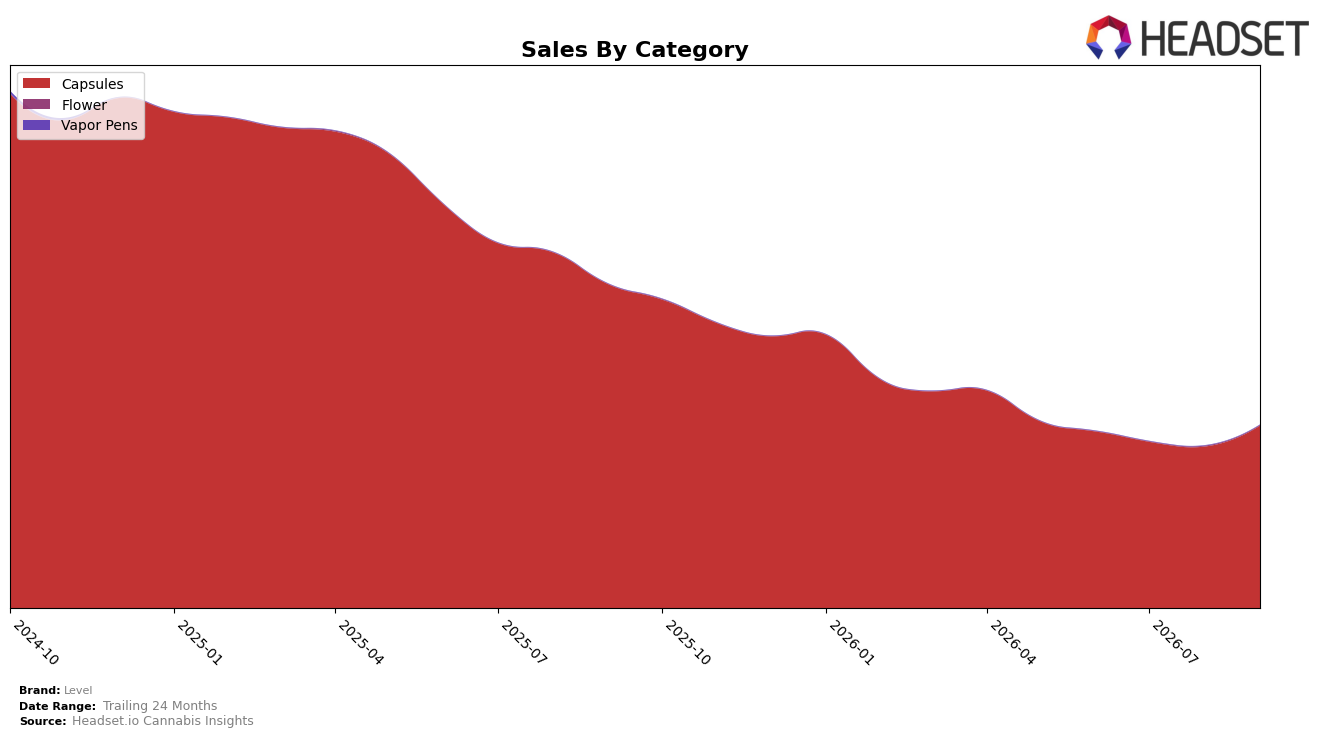
Capsules carried 99.85% share in September 2026 while Flower held 0.15%, with Capsules up 12.98% month over month but down 43.72% year over year; Flower fell 40.59% month over month with no year-over-year baseline. Average selling price declined 32.83% year over year to $16.21 as Capsules priced at $16.20 dominated mix, while overall brand sales fell 43.64% year over year and 64.11% versus 24 months earlier. Level’s Capsules rank at position 1 in Nevada anchors a strategy concentrated in a single format and a few geographies, implying that short-term MoM recovery in Capsules is counterbalanced by ongoing YoY contraction and ultra-narrow category breadth.
With 99.85% of sales in Capsules and only 0.15% in Flower, the 12.98% MoM lift in the core category alongside a 32.83% YoY price drop signals volume-led stabilization but not diversification, while overall brand sales still declined 43.64% YoY. The top state remains CA, yet the rank of 1 in Nevada for Capsules indicates positioning that is depth-first rather than breadth-oriented across states or categories. The pattern implies Level’s pricing reset is supporting short-term share defense within Capsules, but reliance on a single category and uneven state concentration raises sensitivity to category-specific demand cycles despite the current top rank in Nevada.
Competitive Landscape
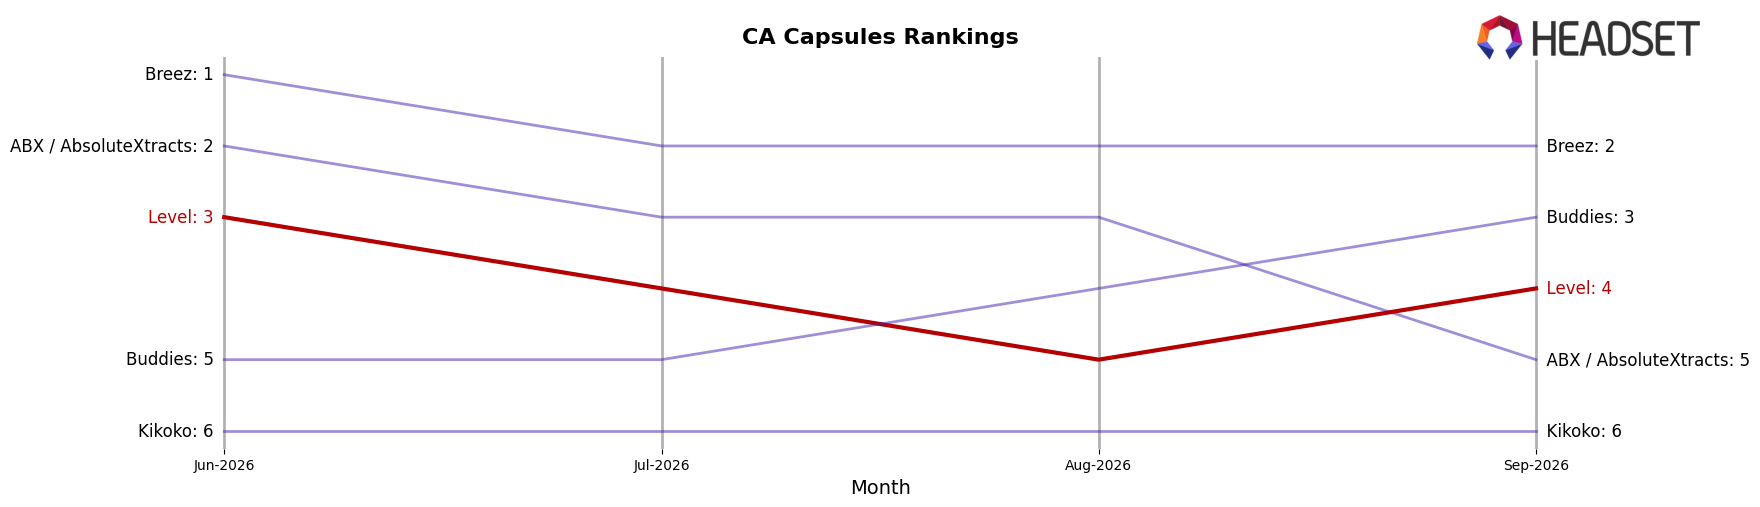
Level is #4 in California Capsules in September 2026, down 1 rank year over year, after sitting at #3 three months ago and previously peaking at #1 in January 2026; meanwhile, Emerald Bay Extracts climbed from #6 to #1 with 109.3% YoY sales growth and Buddies moved from #5 to #3 with 39.1% YoY growth, while Breez rose from #4 to #2 despite a -26.2% YoY sales decline and ABX / AbsoluteXtracts slipped from #3 to #5 with -32.7% YoY sales. The combination of a 1-rank YoY decline for Level and multi-rank gains among two rivals indicates share consolidation above Level and implies that regaining a top-3 spot will require outpacing competitors that are improving rank even with mixed sales velocity.
Notable Products
Hashtab - Indica Tablets 10-Pack (250mg) delivered the clearest movement in September 2026 with an 84.7% month-over-month gain and a rank of 5, while Protab - Sativa Profesional Strength Tablet (100mg) fell 12.4% to rank 2. Protab - Sativa Extra Strength Tablets 10-Pack (250mg) rose 25.8% at rank 4, and Protab - Indica Tablet (100mg) slipped 4.8% but held rank 1, indicating share is rotating toward higher-dosage formats as lower-dosage incumbents cede momentum. Eight of the top ten are Capsules SKUs, and the concentration of 250mg multipacks alongside a single $46,513 seller underscores a tilt toward potency-led baskets over standard 100mg tablets, implying Level’s product mix is migrating toward higher-strength, multi-tablet packs to capture heavier-use occasions.
Top Selling Cannabis Brands






Data for this report comes from real-time sales reporting by participating cannabis retailers via their point-of-sale systems, which are linked up with Headset’s business intelligence software. Headset’s data is very reliable, as it comes digitally direct from our partner retailers. However, the potential does exist for misreporting in the instance of duplicates, incorrectly classified products, inaccurate entry of products into point-of-sale systems, or even simple human error at the point of purchase. Thus, there is a slight margin of error to consider. Brands listed on this page are ranked in the top twenty within the market and product category by total retail sales volume.

