Jan-2025
Sales
Trend
6-Month
Product Count
SKUs
Overview
Market Insights Snapshot
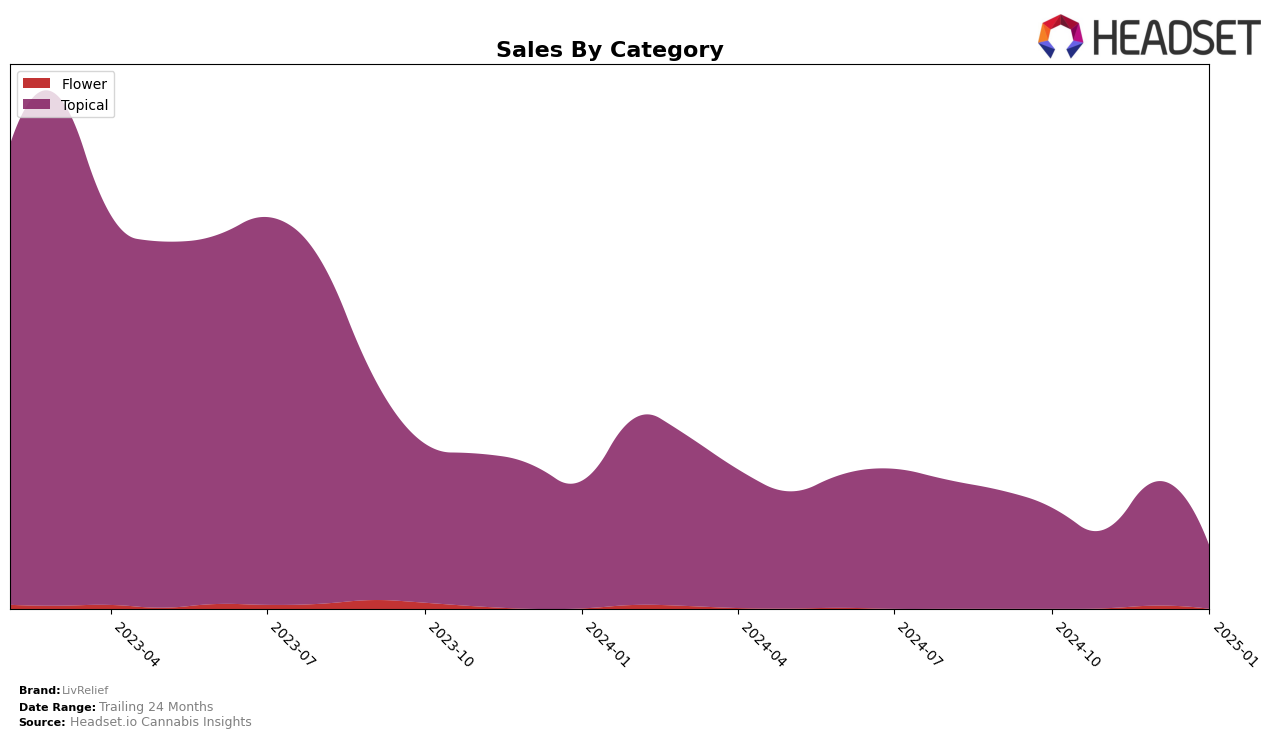
LivRelief has shown a steady performance in the Ontario market, consistently maintaining the 6th position in the Topical category from October 2024 through January 2025. This stability in ranking suggests a strong foothold and possibly a loyal customer base in Ontario. The sales figures in Ontario highlight a peak in December 2024, which could be indicative of seasonal demand or successful marketing strategies during that period. Meanwhile, in Alberta, LivRelief's presence in the Topical category has been more volatile, with the brand dropping out of the top 30 in November 2024 and January 2025, despite being ranked 6th in October and 7th in December. This inconsistency may point to challenges in maintaining market presence or competition dynamics specific to Alberta.
Analyzing the trends in Alberta, the absence of LivRelief from the top 30 in certain months could be a cause for concern, suggesting either a decline in consumer interest or increased competition. The fluctuations in ranking and sales in Alberta contrast with the brand's performance in Ontario, where LivRelief has managed to keep a consistent ranking, albeit with some variation in sales volume. This dichotomy between the two provinces could provide insights into regional market dynamics and consumer preferences. Understanding these differences might be crucial for LivRelief's strategic planning and resource allocation moving forward.
Competitive Landscape
In the Ontario topical cannabis market, LivRelief consistently held the 6th rank from October 2024 through January 2025. Despite maintaining its position, LivRelief faces stiff competition from brands like Dosecann and Solei, which consistently ranked higher at 4th and 5th positions, respectively. Notably, Dosecann showed a significant sales increase in December 2024, which could indicate a potential threat to LivRelief's market share if this trend continues. Meanwhile, RHO Phyto, ranked 7th, showed fluctuating sales but did not surpass LivRelief in rank, suggesting that while LivRelief's position is stable, it must innovate to climb the ranks and capture a larger market share. The absence of Noon & Night from the top 20 in November and January indicates volatility, but their presence in October and December suggests potential for disruption. LivRelief's consistent rank amidst these dynamics highlights its steady presence but also underscores the need for strategic initiatives to improve its competitive standing.

Notable Products
In January 2025, the top-performing product from LivRelief was the CBD/THC 1:1 Transdermal Cream (125mg CBD, 125mg THC, 50ml), maintaining its leading position from the previous two months with sales of 267. The CBD Extra Strength Transdermal Cream (750mg CBD) held steady in the second position, consistent with its rank since November 2024. The CBD Transdermal Cream (250mg CBD, 50g) also showed stability, remaining in third place throughout the months from October 2024 to January 2025. Notably, the CBD Extra Strength Transdermal Cream (1200mg CBD) and the CBD/THC 1:1 Balanced Body Transdermal Cream (250mg CBD, 250mg THC) were not ranked in January 2025, indicating a shift in consumer preference or availability. Overall, the product rankings for January 2025 reflect consistent consumer demand for specific topical products from LivRelief.
Top Selling Cannabis Brands
Data for this report comes from real-time sales reporting by participating cannabis retailers via their point-of-sale systems, which are linked up with Headset’s business intelligence software. Headset’s data is very reliable, as it comes digitally direct from our partner retailers. However, the potential does exist for misreporting in the instance of duplicates, incorrectly classified products, inaccurate entry of products into point-of-sale systems, or even simple human error at the point of purchase. Thus, there is a slight margin of error to consider. Brands listed on this page are ranked in the top twenty within the market and product category by total retail sales volume.

