.svg)
Sep-2026
Sales
Trend
6-Month
Product Count
SKUs
Avg Price
YoY Sales Change
YoY Price Change


Where to Buy
Magic Number is stocked at 286 licensed dispensaries across Oregon, with the deepest coverage in Portland, Eugene, Salem, Bend, and Medford. Search by ZIP code or city below to find the closest one, or filter by product type if you are after a specific format.
Market Insights Snapshot
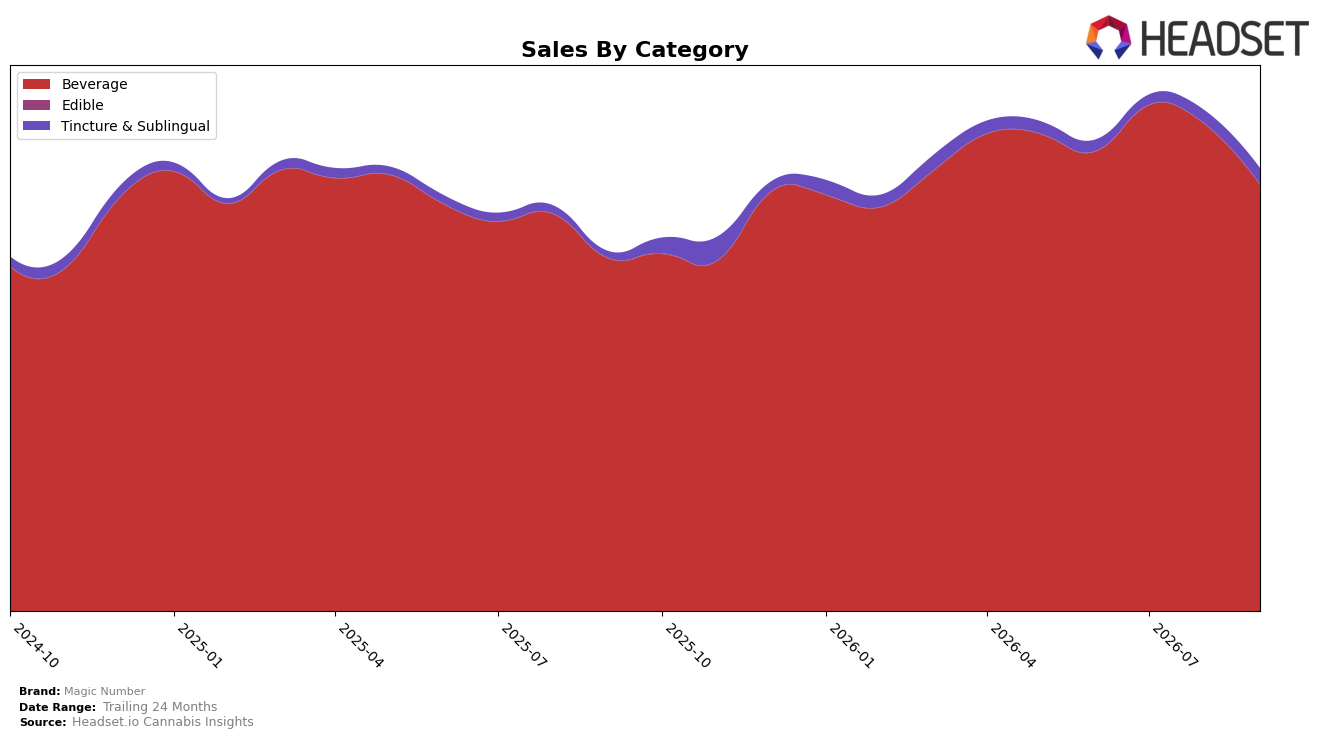
In September 2026, Magic Number concentrated 96.41% of sales in Beverage, with Tincture & Sublingual holding 3.59%, a mix that tightened versus month-over-month as Beverage declined 12.45% while Tincture & Sublingual grew 21.75%. Year-over-year, Beverage expanded 20.94% but ceded relative momentum to Tincture & Sublingual at 145.64%, and the brand’s average price rose 0.86% to $10.63 while Beverage’s average price sat at $10.39. With Beverage ranked 1 in Oregon and the mix shift favoring a faster-growing but small secondary category, the data implies the brand’s core remains anchored in Beverage leadership while selectively scaling a premium-priced Tincture & Sublingual niche.
The contrasting growth rates—Beverage at 20.94% YoY versus Tincture & Sublingual at 145.64% YoY—and the split in monthly trajectories—Beverage down 12.45% MoM versus Tincture & Sublingual up 21.75% MoM—suggest near-term elasticity in the core paired with an expansion vector in a higher-price tier. Coupled with a number 1 Beverage rank in Oregon and total brand sales growing 23.14% YoY, the positioning implication is a defend-and-extend footprint: defend Beverage share leadership while extending into Tincture & Sublingual to diversify growth and smooth month-to-month volatility.
Competitive Landscape
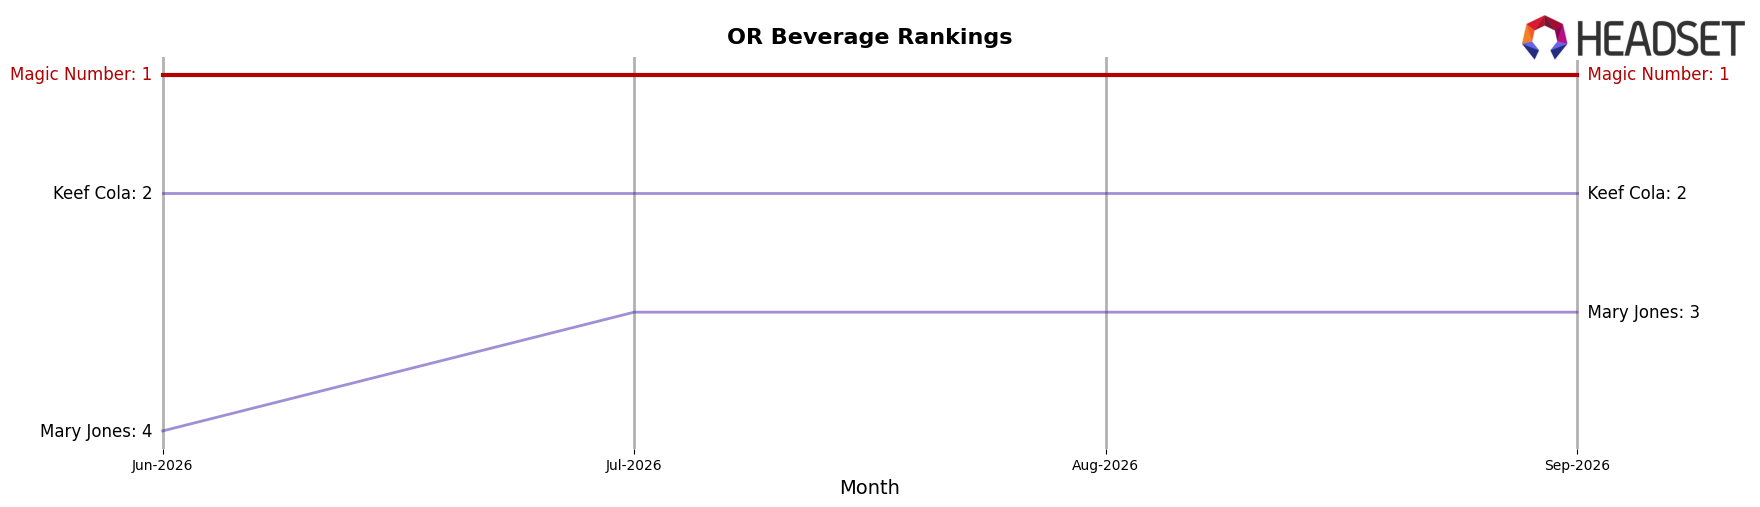
Magic Number holds #1 in OR Beverage in September 2026, unchanged YoY from #1, while Keef Cola sits at #2 with a -37.9% YoY sales change and Mary Jones remains #3 with +0.6% YoY sales; stability at #1 over both the year and the last three months suggests category share is consolidating at the top as rivals either contract or post marginal growth. Compared with Mule Extracts holding #4 and -2.2% YoY sales and Crown B Alchemy at #5 with -23.6% YoY sales, Magic Number’s unshifted #1 rank and peak position in September 2026 indicate the trajectory points to sustained leadership rather than short-term volatility.
Notable Products
Sasparilla Soda (100mg THC, 12oz) set the tone with a -21.9% month-over-month drop while holding rank 1, and Blue Raspberry Live Resin Soda (100mg THC, 355ml) slid -18.4% at rank 4, indicating demand compression at the high-dose end. Bright and Citrusy Limeade (100mg THC, 12oz, 237ml) also fell -20.4% at rank 5 as Cherry Vanilla Soda (100mg THC,355ml, 12oz) declined -14.9% at rank 6, while the 25mg Cherry Vanilla Soda rose +16.3% at rank 7, pointing to a shift toward lower-dose formats within the same flavors. With all top-10 items in Beverage and only one clear gainer against multiple declines over -10%, the mix implies Magic Number is over-indexed in 100mg SKUs and should rebalance toward 25mg variants to stabilize September 2026 velocity.
Top Selling Cannabis Brands






Data for this report comes from real-time sales reporting by participating cannabis retailers via their point-of-sale systems, which are linked up with Headset’s business intelligence software. Headset’s data is very reliable, as it comes digitally direct from our partner retailers. However, the potential does exist for misreporting in the instance of duplicates, incorrectly classified products, inaccurate entry of products into point-of-sale systems, or even simple human error at the point of purchase. Thus, there is a slight margin of error to consider. Brands listed on this page are ranked in the top twenty within the market and product category by total retail sales volume.

