Jun-2026
Sales
Trend
6-Month
Product Count
SKUs
Avg Price
YoY Sales Change
YoY Price Change
Market Insights Snapshot
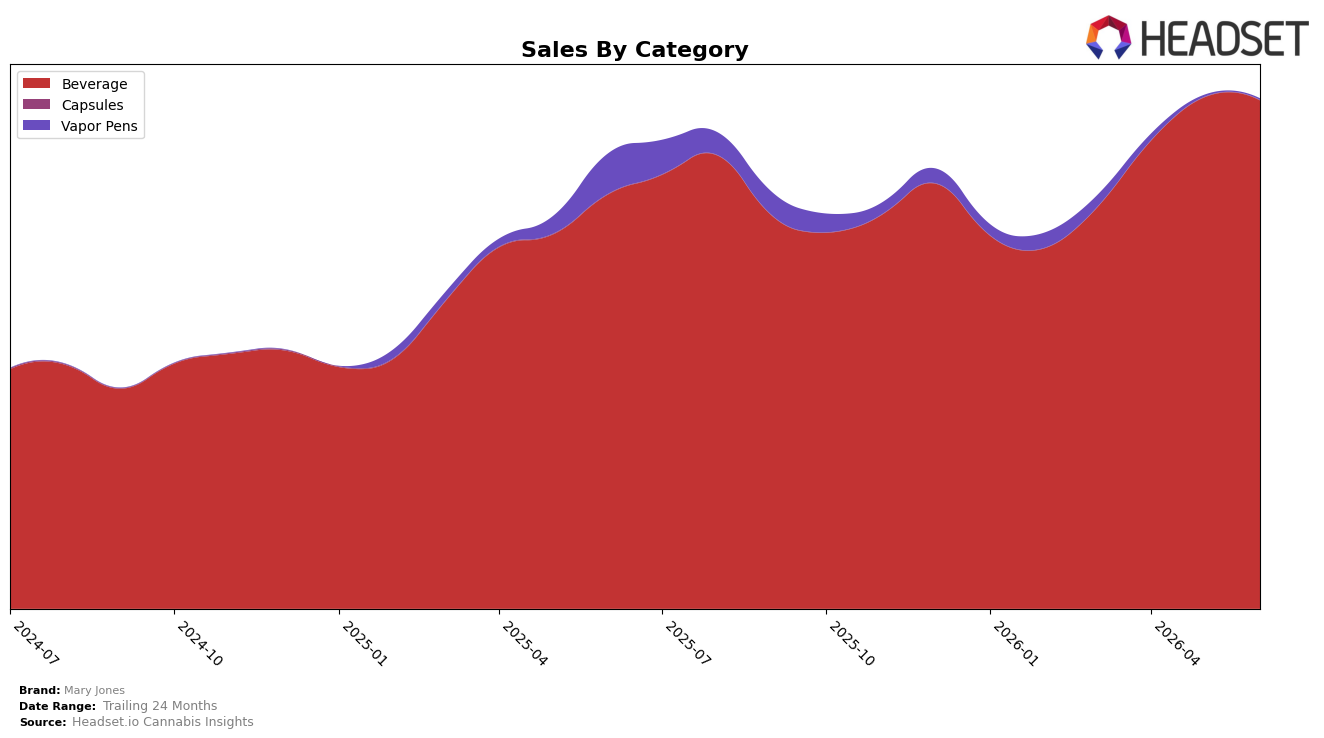
In June 2026, Mary Jones concentrated 99.77% of sales in Beverage while Vapor Pens fell to 0.23% share, a mix skew that tightened versus May 2026 as Beverage declined 0.62% month over month and Vapor Pens dropped 29.54% month over month. Year over year, Beverage expanded 22.70% while Vapor Pens contracted 97.07%, a divergence that coincided with an 11.25% decrease in average price and a 12.11% overall sales lift. With Beverage ranked 1 in Michigan, the pattern implies Mary Jones is consolidating around Beverage leadership while intentionally or operationally exiting Vapor Pens.
The shift concentrates pricing power and promotional levers inside Beverage, where lower average price (down 11.25% YoY) and higher unit velocity can support rank 1 retention even as category revenue dipped 0.62% MoM. The near-elimination of Vapor Pens (share 0.23%, down 29.54% MoM and 97.07% YoY) reduces portfolio diversification risk mitigation but frees focus to defend Beverage share at 99.77% and sustain June 2026 YoY growth of 22.70%; the implication is a single-category positioning that prioritizes unit expansion over premium pricing.
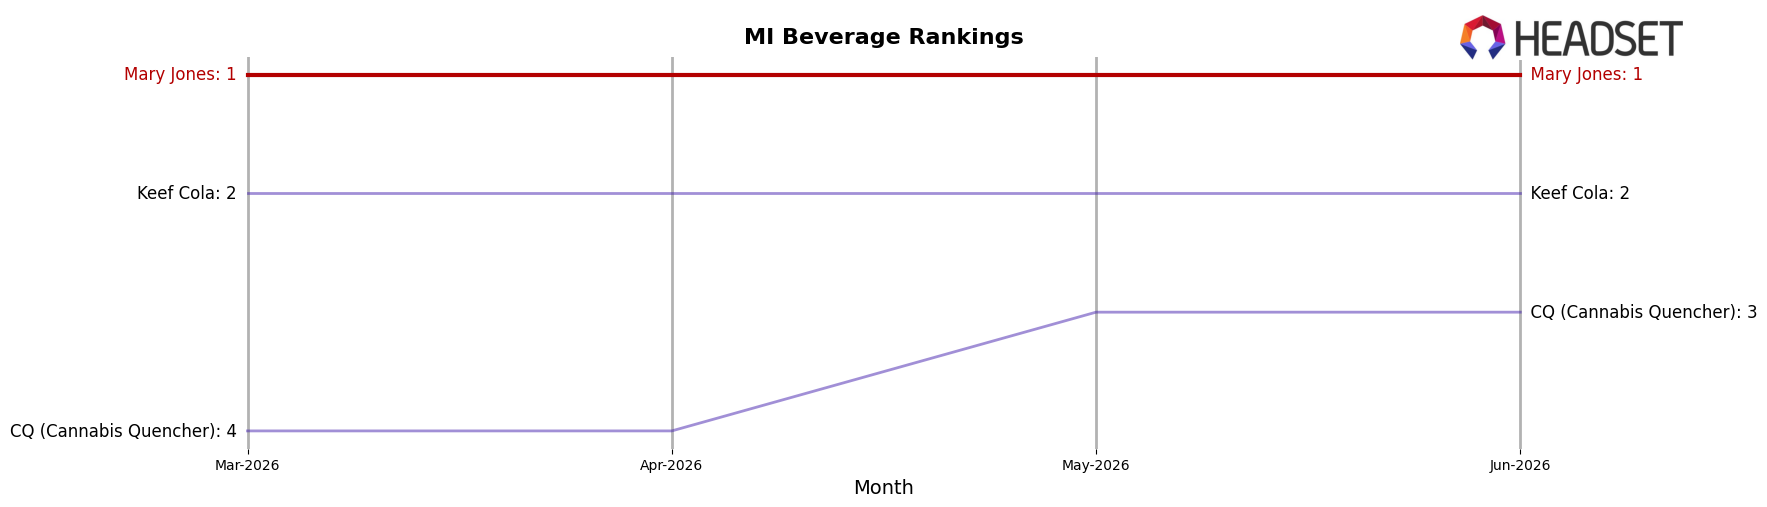
Competitive Landscape
Mary Jones is #1 in MI Beverage in June 2026, up 1 place year over year from #2, and holding at #1 versus three months ago, which places its current peak rank at #1 in June 2026; meanwhile, Keef Cola slipped from #1 to #2 with sales down 10.46% year over year as CQ (Cannabis Quencher) climbed from #7 to #3 with sales up 138.04%. With Chill Medicated jumping from #8 to #4 on 177.33% growth while Pleasantea moved from #6 to #5 on 34.92% growth, the mix beneath the top spot is rotating quickly, implying that Mary Jones’s hold on #1 depends on defending share against faster-rising challengers rather than legacy leaders.
Notable Products
MF Grape Soda (100mg THC, 12oz, 355ml) posted the steepest decline at -9.48% month over month while Root Beer Soda (10mg THC, 355ml, 12oz) fell -5.37%, yet Berry Lemonade Soda (100mg THC, 12oz, 355ml) held rank 1 with +3.27% and Zero Berry Lemonade Soda (10mg THC, 12oz, 355ml) stayed at rank 2 with +0.28%. With seven of the top ten clustered in ranks 1–7, Orange & Cream Soda (10mg THC, 12oz) in rank 9 gained +3.36% as Root Beer Soda (100mg THC, 16oz) in rank 7 added +3.50%, indicating selective momentum at the top despite a mid-pack pullback. All ten top products are Beverage SKUs and nine show single-digit changes while one registers a near -10% drop, and only one SKU lacks a reported MoM figure alongside a $68,229 tally. The pattern implies Mary Jones is stabilizing share through flagship lemonade and legacy cola profiles while pruning or repositioning flavor extensions that are slipping.
Top Selling Cannabis Brands
Data for this report comes from real-time sales reporting by participating cannabis retailers via their point-of-sale systems, which are linked up with Headset’s business intelligence software. Headset’s data is very reliable, as it comes digitally direct from our partner retailers. However, the potential does exist for misreporting in the instance of duplicates, incorrectly classified products, inaccurate entry of products into point-of-sale systems, or even simple human error at the point of purchase. Thus, there is a slight margin of error to consider. Brands listed on this page are ranked in the top twenty within the market and product category by total retail sales volume.

