May-2026
Sales
Trend
6-Month
Product Count
SKUs
Avg Price
YoY Sales Change
YoY Price Change
Market Insights Snapshot
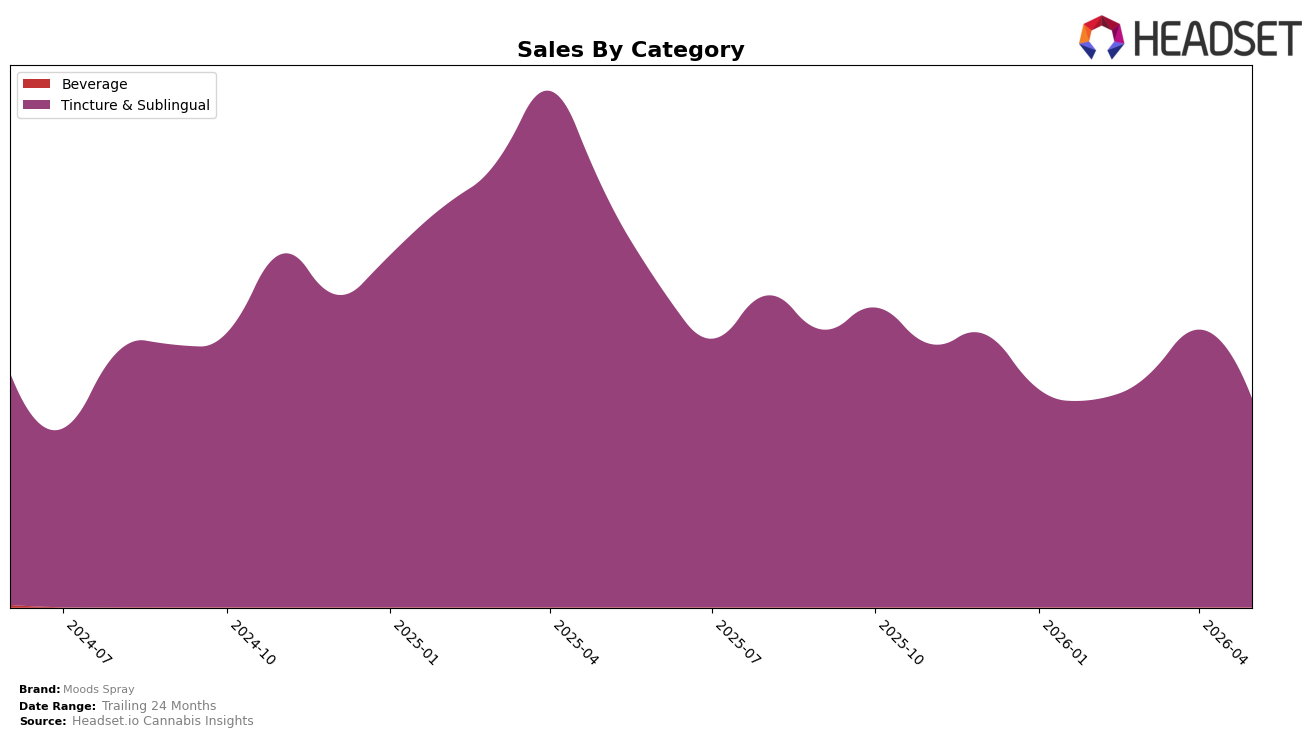
In May 2026, Moods Spray operated as a single-category brand in Tincture & Sublingual, with a 100.0% mix concentrated there and a rank of 13 in California. Within this category, sales declined 50.0% year over year and 24.8% month over month, while average price decreased 4.9% YoY; together these shifts indicate that volume contraction, not just pricing, is driving the downturn. With no diversification beyond Tincture & Sublingual and a full reliance on that 100.0% share of mix, the pattern implies exposure to category-specific headwinds that compress both demand and pricing power.
The combination of a 13th-place rank in California and a 24.8% MoM drop alongside a 50.0% YoY decline suggests Moods Spray is ceding velocity faster than category pricing trends would explain, given only a 4.9% YoY price decrease. A fully concentrated 100.0% category mix means any recovery requires either rank gains within Tincture & Sublingual or strategic mix expansion; the current trajectory implies that maintaining price while improving sell-through would do more for share than additional discounting.
Competitive Landscape
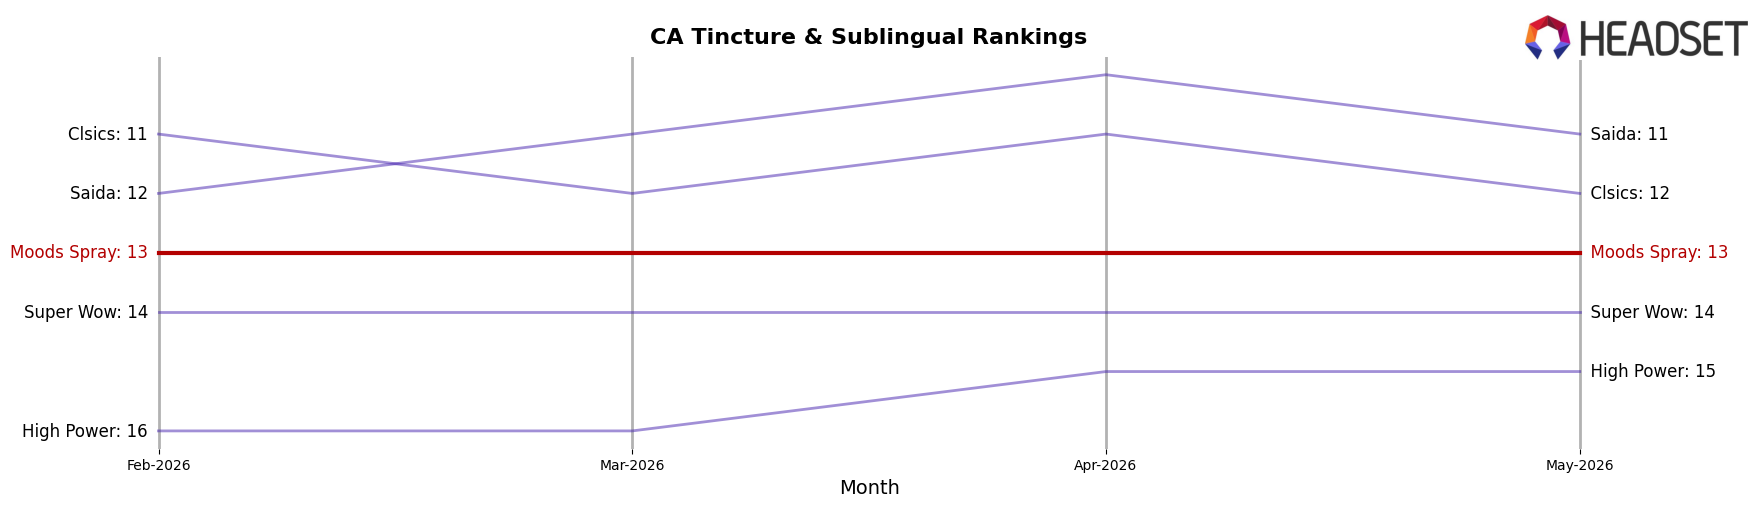
Moods Spray ranks #13 in CA Tincture & Sublingual in May 2026, down 3 positions year over year from #10, with no change versus February 2026 at #13, while the category leaders are also retrenching as Papa & Barkley holds #1 but posted a -13.3% YoY sales decline and Yummi Karma holds #2 with a -7.6% YoY sales decline; meanwhile, ABX / AbsoluteXtracts improved rank from #6 to #5 despite a -12.5% YoY sales drop, indicating share is being redistributed among mid-tier players rather than expanding at the top. With Moods Spray slipping from its peak #10 in May 2025 to #13 and competitors maintaining top-5 positions despite negative double-digit YoY percentages, the pattern implies Moods Spray’s rank trajectory is compressing into a stable-but-lower tier where marginal share shifts, not category growth, will determine whether it rebounds toward the top 10 or drifts further down.
Notable Products
Pineapple Fanta High Sublingual Oral Spray (1000mg THC, 14ml, 0.49fl oz) posted the steepest decline in May 2026 at -40.2% MoM, sliding to rank 5, while Grape Soda High Sublingual Oral Spray (1000mg THC, 14ml, 0.49fl oz) fell -33.3% to rank 7. At the top, Watermelon Z High Sublingual Oral Spray (1000mg THC, 14ml, 0.49fl oz) inched up +3.9% MoM to hold rank 1, as Blueberry Kush High Sublingual Oral Spray (1000mg THC, 14ml, 0.49fl oz) dropped -11.5% to rank 2. Four of the top five are 1000mg THC SKUs and three of the bottom four registered declines worse than -33%, indicating concentration at high potency but growing volatility among flavors. The pattern implies Moods Spray is anchored by a single flagship at rank 1, while flavor breadth within the 1000mg tier is overextended and susceptible to rapid month-to-month swings, suggesting portfolio pruning or staggered flavor rotations could stabilize ranks.
Top Selling Cannabis Brands
Data for this report comes from real-time sales reporting by participating cannabis retailers via their point-of-sale systems, which are linked up with Headset’s business intelligence software. Headset’s data is very reliable, as it comes digitally direct from our partner retailers. However, the potential does exist for misreporting in the instance of duplicates, incorrectly classified products, inaccurate entry of products into point-of-sale systems, or even simple human error at the point of purchase. Thus, there is a slight margin of error to consider. Brands listed on this page are ranked in the top twenty within the market and product category by total retail sales volume.

