Jan-2025
Sales
Trend
6-Month
Product Count
SKUs
Overview
Market Insights Snapshot
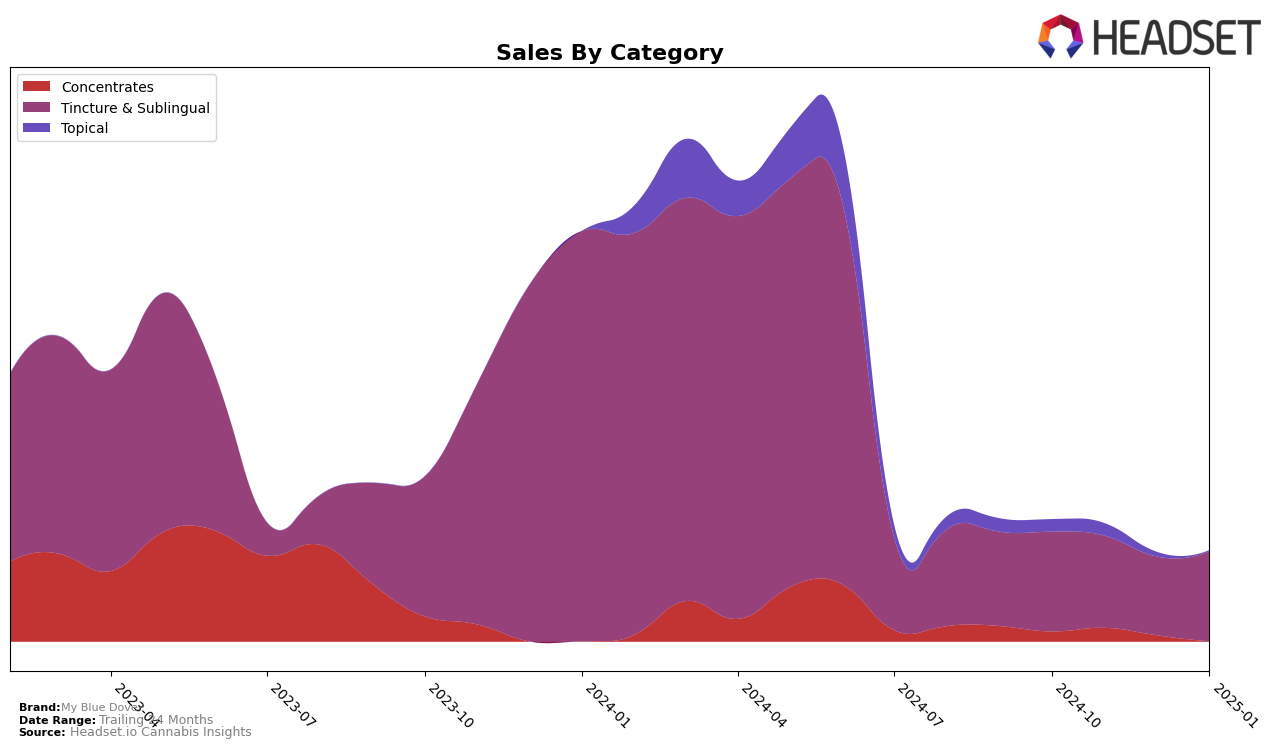
My Blue Dove has shown consistent performance in the California market within the Tincture & Sublingual category. Over the four-month period from October 2024 to January 2025, the brand maintained its position around the 18th and 19th ranks, indicating a stable presence in the top 20. This steadiness is noteworthy, especially considering the competitive nature of the California market. The sales figures, although experiencing a slight dip in December, rebounded in January, suggesting resilience in consumer demand for their products. It is important to note that maintaining a consistent ranking within the top 20 in such a populous state is a testament to the brand's strong market penetration and appeal.
However, the absence of My Blue Dove from the top 30 rankings in other states or provinces during this period might indicate a more localized success, with their influence not extending significantly beyond California. This could be seen as a missed opportunity for expansion or a strategic focus on dominating a specific market. While the brand's performance in California is commendable, the lack of broader geographical presence might suggest areas for potential growth or diversification in their market strategy. This localized success could be leveraged to explore new markets or strengthen their position in other regions, potentially leading to increased brand recognition and sales in the future.
Competitive Landscape
In the competitive landscape of the Tincture & Sublingual category in California, My Blue Dove has maintained a consistent rank of 18th from October 2024 to January 2025, despite fluctuations in sales figures. This stability in rank suggests a resilient market position amidst varying sales performance. Notably, Moods Spray consistently outperformed My Blue Dove, maintaining a top 12 position, indicating a strong consumer preference that My Blue Dove could aim to capture. Meanwhile, Carter's Aromatherapy Designs (C.A.D.) held a steady 13th rank, with sales figures significantly higher than My Blue Dove's, suggesting a potential area for growth. Interestingly, Dr. May experienced a decline in rank, dropping to 19th by January 2025, which could present an opportunity for My Blue Dove to capitalize on any shifts in consumer loyalty. Overall, while My Blue Dove's rank remained stable, the competitive dynamics highlight areas for strategic focus to enhance market share and sales performance.

Notable Products
In January 2025, My Blue Dove's top-performing product was the CBD MCT Tincture (500mg CBD, 30ml, 1oz) from the Tincture & Sublingual category, retaining its top position with notable sales of 1171 units. The Hybrid Tincture (1000mg THC, 30ml) followed closely, dropping to the second rank from its peak in December, where it was ranked first. The THC Tincture (1000mg THC, 30ml) saw a significant rise in popularity, moving up to the third position from fifth in December. The Indica Tincture (1000mg THC, 30ml) maintained a stable fourth position, consistent with its performance in December. Meanwhile, the Sativa Tincture (1000mg THC, 30ml) dropped to fifth place, marking a decline from its previous higher rankings in earlier months.
Top Selling Cannabis Brands
Data for this report comes from real-time sales reporting by participating cannabis retailers via their point-of-sale systems, which are linked up with Headset’s business intelligence software. Headset’s data is very reliable, as it comes digitally direct from our partner retailers. However, the potential does exist for misreporting in the instance of duplicates, incorrectly classified products, inaccurate entry of products into point-of-sale systems, or even simple human error at the point of purchase. Thus, there is a slight margin of error to consider. Brands listed on this page are ranked in the top twenty within the market and product category by total retail sales volume.

