Mar-2025
Sales
Trend
6-Month
Product Count
SKUs
Overview
Market Insights Snapshot
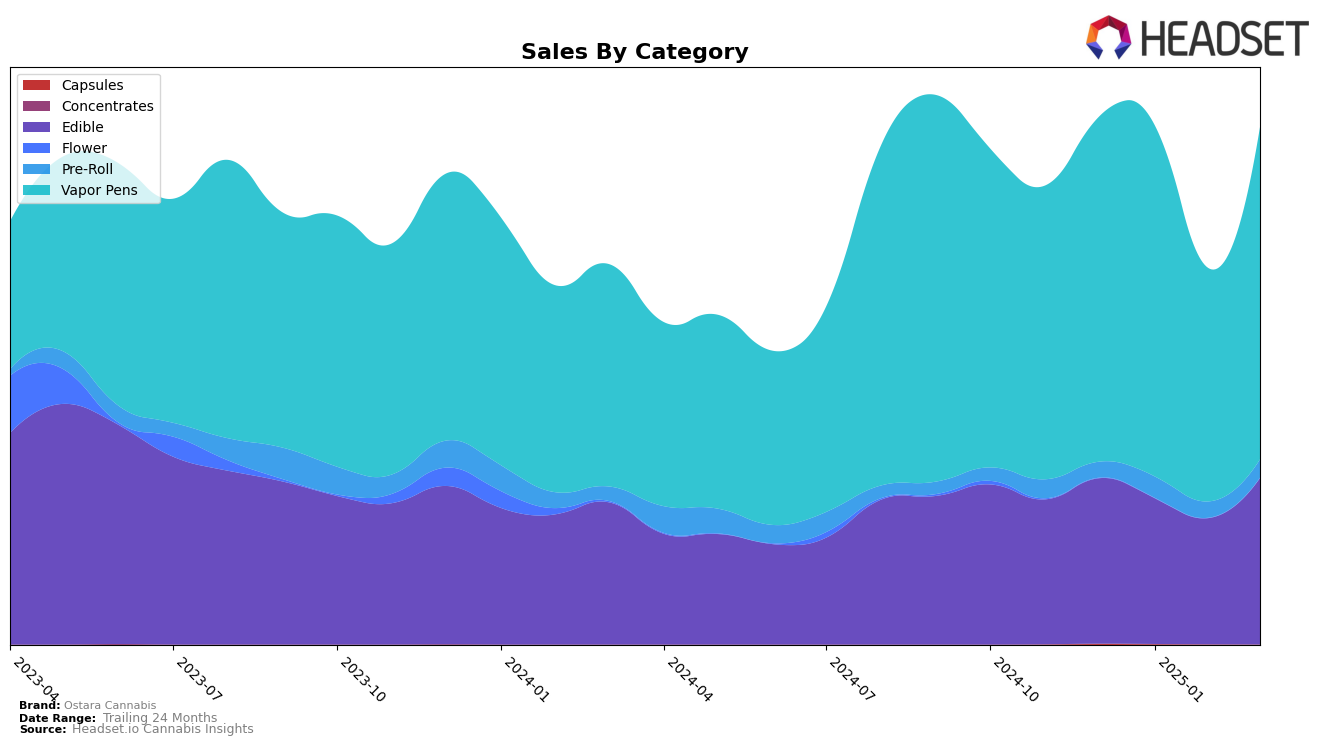
Ostara Cannabis has shown a dynamic performance across various product categories in Missouri. In the Edible category, the brand maintained a strong presence, with a notable fluctuation in rankings from December 2024 to March 2025. Starting at 10th place in December, Ostara Cannabis improved to 9th in January, dipped to 11th in February, and then returned to 9th in March. This oscillation suggests a competitive landscape where Ostara Cannabis is holding its ground. The Vapor Pens category also saw significant movement, with the brand jumping from 11th to 6th place between December and January, although it experienced a setback in February, falling to 17th, before climbing back to 14th in March. Such movements indicate a strong but volatile presence in this category.
In contrast, Ostara Cannabis's performance in the Pre-Roll category in Missouri highlights some challenges. The brand was not ranked in the top 30 during the initial months, suggesting a struggle to capture significant market share. However, by January, it made a breakthrough, securing the 40th spot, and although it slipped to 50th in February, it slightly improved to 47th in March. This gradual improvement could indicate efforts to enhance their product offerings or market strategies in this category. While the brand's sales figures in Vapor Pens remained relatively high, the Pre-Roll category's performance suggests potential areas for growth and focus.
Competitive Landscape
In the competitive landscape of vapor pens in Missouri, Ostara Cannabis has experienced notable fluctuations in its market position from December 2024 to March 2025. Starting from 11th place in December, Ostara Cannabis impressively climbed to 6th in January, showcasing a significant improvement in rank. However, this upward trend was short-lived as the brand dropped to 17th in February before recovering slightly to 14th in March. This volatility in rank is mirrored in sales performance, with a peak in January followed by a dip in February. Competitors like STIIIZY and Buoyant Bob have also shown dynamic movements, with STIIIZY maintaining a strong presence despite missing the top 20 in January, and Buoyant Bob consistently hovering around the mid-teens. Meanwhile, Vibe Cannabis (MO) has shown a steady rise from 21st to 16th, indicating growing market traction. These shifts highlight the competitive pressures Ostara Cannabis faces, emphasizing the need for strategic adjustments to sustain and enhance its market share in Missouri's vapor pen category.

Notable Products
In March 2025, Ostara Cannabis's top-performing product was Sour Variety Gummies 10-Pack (100mg), maintaining its number one rank from February, with a notable sales figure of 6609. The THC/CBG 1:1 Rise Variety Sour Gummies 10-Pack (100mg THC, 100mg CBG) held steady in the second position, showing consistent popularity across the months. Peach Tree Cookies Pre-Roll (0.5g) remained in third place, recovering from a dip in February sales. Gold Variety High Dose Gummies 10-Pack (200mg) improved slightly in sales, securing the fourth spot for March. The THC/CBN 5:2 Rest Variety Sour Gummies 10-Pack (100mg THC, 40mg CBN) saw a decline in ranking, moving from fourth in February to fifth in March.
Top Selling Cannabis Brands
Data for this report comes from real-time sales reporting by participating cannabis retailers via their point-of-sale systems, which are linked up with Headset’s business intelligence software. Headset’s data is very reliable, as it comes digitally direct from our partner retailers. However, the potential does exist for misreporting in the instance of duplicates, incorrectly classified products, inaccurate entry of products into point-of-sale systems, or even simple human error at the point of purchase. Thus, there is a slight margin of error to consider. Brands listed on this page are ranked in the top twenty within the market and product category by total retail sales volume.

