Jan-2025
Sales
Trend
6-Month
Product Count
SKUs
Overview
Market Insights Snapshot
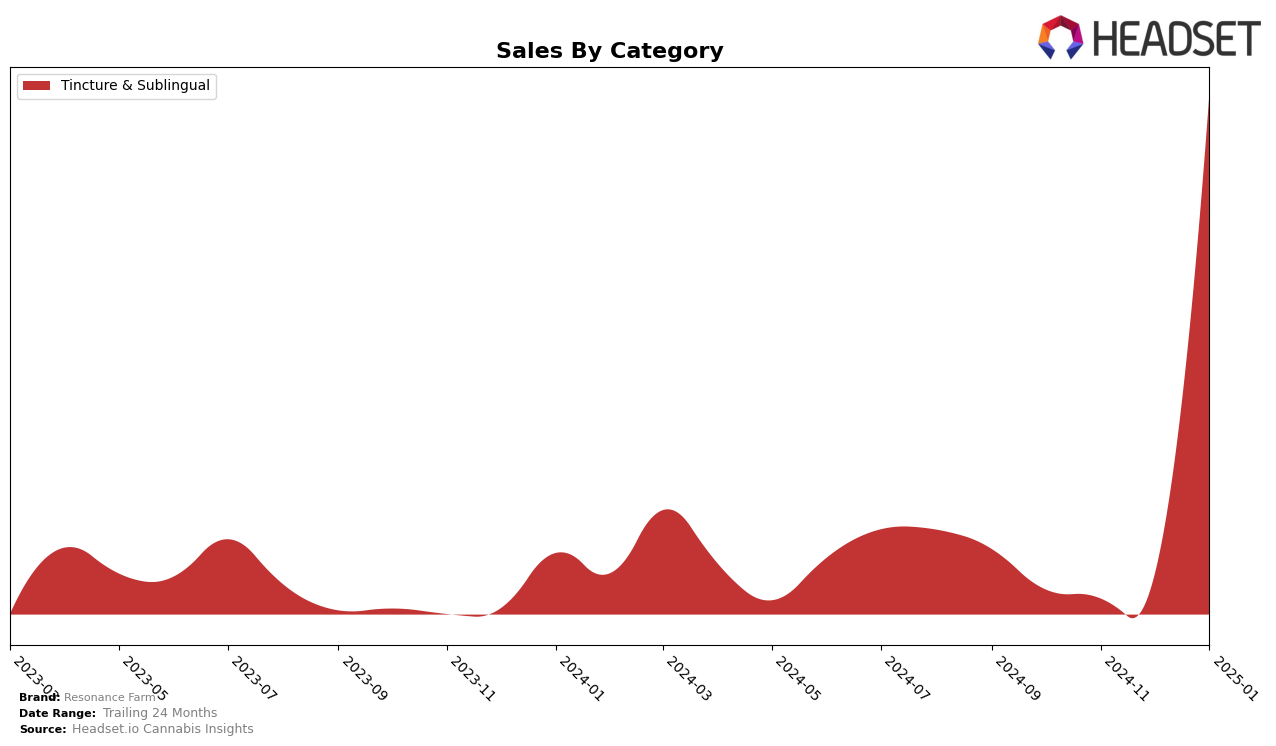
Resonance Farm has shown a notable entrance in the Tincture & Sublingual category in Oregon. After not appearing in the top 30 rankings for the months of October through December 2024, the brand made a significant leap in January 2025, securing the 12th position. This sudden emergence in the rankings suggests a strategic or market-driven change that has positively impacted their visibility and sales within the state. Although specific sales figures for the earlier months are not available, the January sales figure of $12,041 indicates a strong performance that likely contributed to their improved ranking.
While the data from other states or provinces is not provided, Resonance Farm's performance in Oregon hints at a potentially focused approach to regional market penetration. The absence of rankings in the prior months could imply either a late entry into the market or an initial struggle to gain traction. However, the brand's ability to break into the top 30 and achieve a 12th place ranking by January 2025 is a positive indicator of its growing influence in the Oregon market. Observing their future movements and whether they expand this success to other states or categories could provide further insights into their overall strategy and market adaptability.
```Competitive Landscape
In the competitive landscape of the Tincture & Sublingual category in Oregon, Resonance Farm has shown a notable entry into the rankings by January 2025, securing the 12th position. This marks a significant achievement for Resonance Farm as it was absent from the top 20 in the preceding months, indicating a strategic breakthrough in market penetration. In contrast, Medicine Farm experienced fluctuations, moving from 14th in November to 12th in December, before dropping out of the top 20 by January. Meanwhile, THClear Co showed a strong performance, peaking at 8th in November but also dropping out by December, only to reappear at 13th in January. Luminous Botanicals maintained a relatively stable presence, improving from 13th in December to 11th in January, while Crown B Alchemy consistently held a top 10 position, though it saw a gradual decline from 8th in October to 10th by January. Resonance Farm's emergence in the rankings could be attributed to strategic marketing efforts or product differentiation, as it managed to surpass several established competitors in a short span, suggesting potential for continued growth in sales and market share.

Notable Products
In January 2025, Resonance Farm's top-performing product was the CBG Full Strength Formula Tincture (2000mg CBG, 1oz) in the Tincture & Sublingual category, achieving the number one rank with notable sales of 224 units. The CBD/CBG 40:1 Full Spectrum Hemp Tincture (2000mg CBG, 50mg CBD) dropped from its consistent first-place position in previous months to second place. The CBG 700mg Hemp Tincture maintained its second-place ranking from December 2024, sharing the position with the CBD/CBG 40:1 Tincture in January 2025. This indicates a strong performance from the CBG Full Strength Formula Tincture, overtaking the previous leader. Overall, the Tincture & Sublingual category continues to dominate Resonance Farm's sales, with slight shifts in product rankings.
Top Selling Cannabis Brands
Data for this report comes from real-time sales reporting by participating cannabis retailers via their point-of-sale systems, which are linked up with Headset’s business intelligence software. Headset’s data is very reliable, as it comes digitally direct from our partner retailers. However, the potential does exist for misreporting in the instance of duplicates, incorrectly classified products, inaccurate entry of products into point-of-sale systems, or even simple human error at the point of purchase. Thus, there is a slight margin of error to consider. Brands listed on this page are ranked in the top twenty within the market and product category by total retail sales volume.

