Dec-2024
Sales
Trend
6-Month
Product Count
SKUs
Overview
Market Insights Snapshot
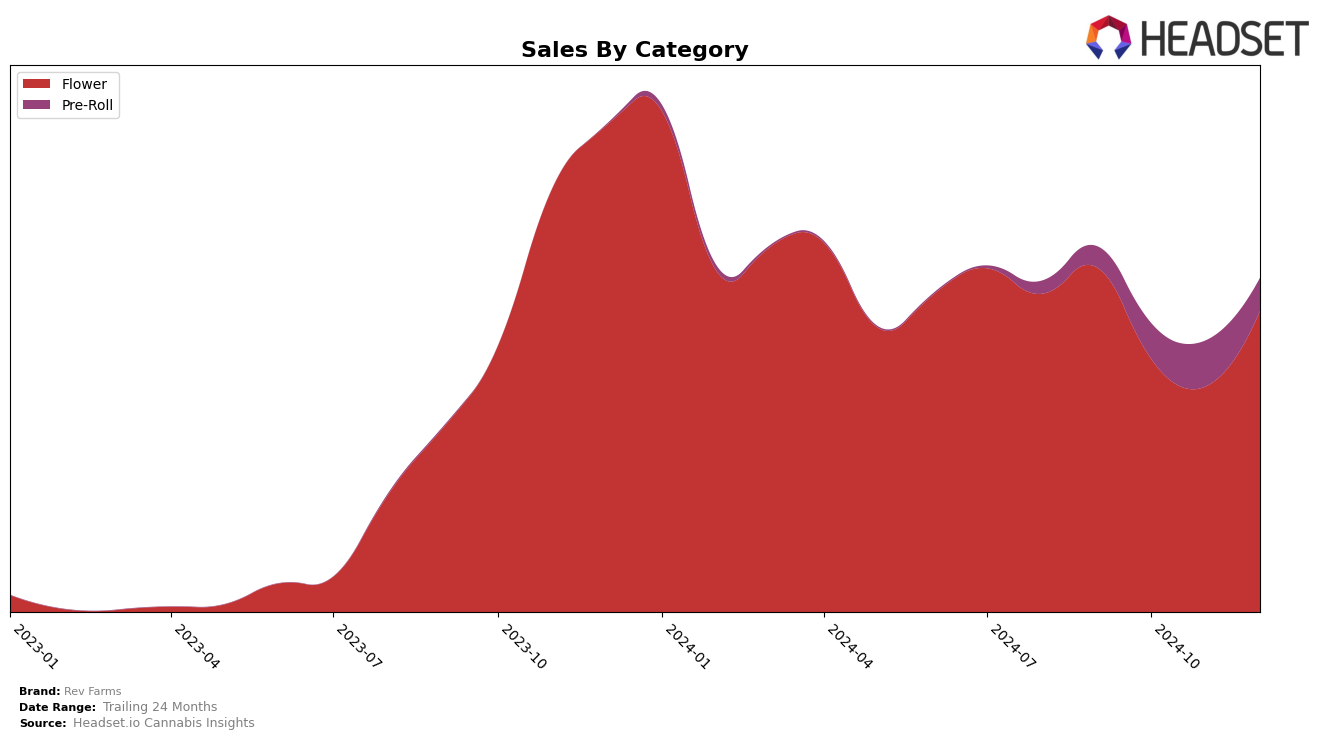
Rev Farms has shown varied performance across different categories and states in recent months. In Massachusetts, the brand's standing in the Flower category saw some fluctuations, with a notable drop from 16th place in September 2024 to 40th in November, before rebounding to 19th in December. This movement suggests a volatile market presence, likely influenced by competitive dynamics or changes in consumer preferences. Meanwhile, in the Pre-Roll category, Rev Farms did not make it into the top 30 rankings, although there was an improvement from 100th place in September to 61st in November, signaling some positive traction in this segment.
In Oregon, Rev Farms' entry into the Flower category was marked by a debut at 53rd place in December 2024. This ranking indicates a nascent presence in the state, suggesting that the brand is still in the early stages of establishing its footprint in Oregon's competitive market. The absence of rankings in earlier months could imply either a recent market entry or a prior lack of significant sales. These movements across states and categories highlight both challenges and opportunities for Rev Farms as it navigates diverse market landscapes.
Competitive Landscape
In the Massachusetts flower category, Rev Farms experienced a dynamic shift in rankings from September to December 2024, reflecting a competitive landscape that significantly impacts its market position. Starting at rank 16 in September, Rev Farms saw a decline to rank 27 in October and further down to 40 in November, before rebounding to 19 in December. This fluctuation indicates a volatile market presence, possibly due to competitive pressures and changing consumer preferences. Meanwhile, Shaka Cannabis Company also experienced a drop, moving from rank 11 in September to 20 in December, suggesting a similar struggle in maintaining market share. Conversely, Trees Co. (TC) improved its standing significantly, climbing from rank 34 in September to 18 in December, which could indicate successful strategic initiatives or product offerings that resonated with consumers. Galactic maintained a relatively stable position, consistently ranking around 17, suggesting a steady performance amidst the competitive shifts. Rev Farms' sales trajectory, with a notable dip in October and November, followed by a recovery in December, highlights the need for strategic adjustments to enhance competitiveness and capitalize on market opportunities.

Notable Products
In December 2024, the top-performing product for Rev Farms was White Wedding Haze (3.5g) in the Flower category, securing the number one rank with sales of 3693 units. Ice Cream Cake (3.5g), another Flower product, rose to second place from its previous third place in September 2024, with a notable increase in sales to 3331 units. Trippy Breakfast (3.5g) saw a slight dip, moving from the top spot in November to third in December, indicating a decrease in demand. Alien Rock Candy (3.5g) maintained a consistent presence in the rankings, holding the fourth position. Sour Lemons Pre-Roll (1g) also showed stability, remaining in fifth place from October to December, reflecting steady sales in the Pre-Roll category.
Top Selling Cannabis Brands
Data for this report comes from real-time sales reporting by participating cannabis retailers via their point-of-sale systems, which are linked up with Headset’s business intelligence software. Headset’s data is very reliable, as it comes digitally direct from our partner retailers. However, the potential does exist for misreporting in the instance of duplicates, incorrectly classified products, inaccurate entry of products into point-of-sale systems, or even simple human error at the point of purchase. Thus, there is a slight margin of error to consider. Brands listed on this page are ranked in the top twenty within the market and product category by total retail sales volume.

