Mar-2025
Sales
Trend
6-Month
Product Count
SKUs
Overview
Market Insights Snapshot
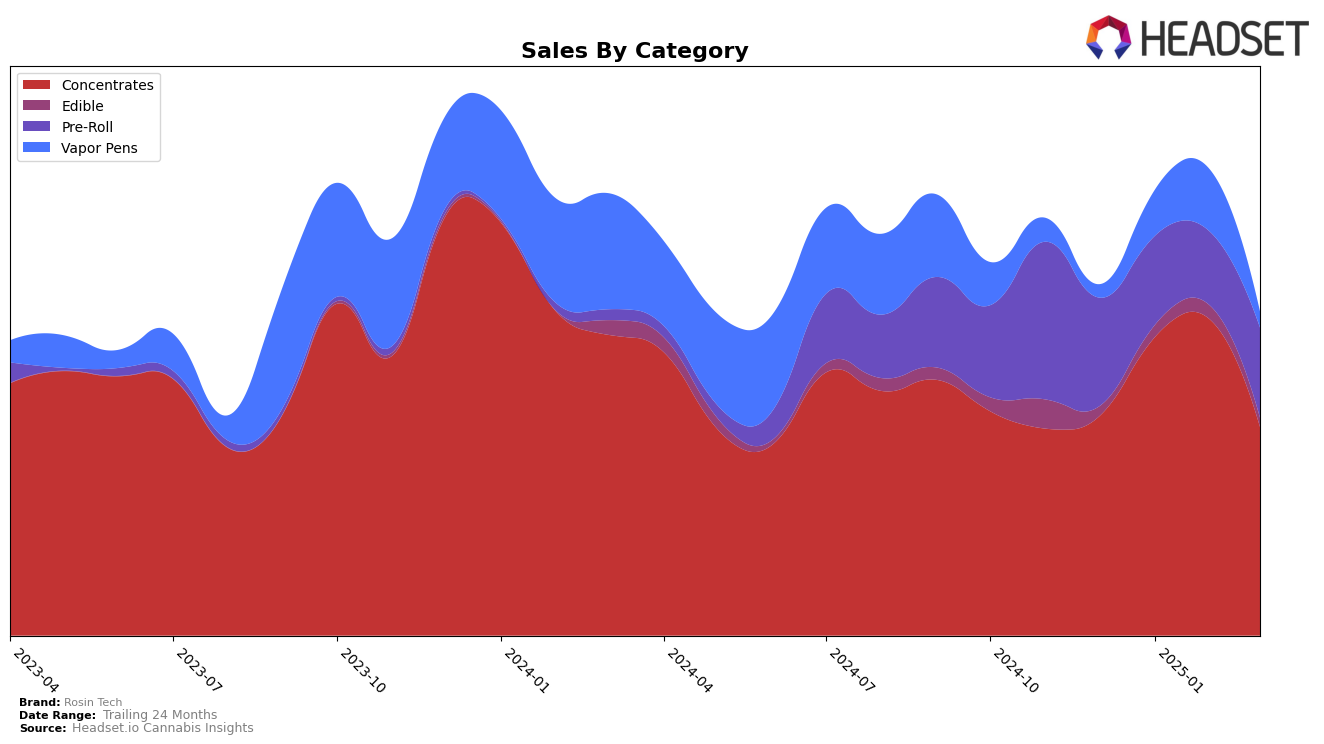
Rosin Tech has demonstrated a fluctuating performance in the California concentrates market over the past few months. In December 2024, Rosin Tech was ranked 27th, but by January 2025, it had climbed to 17th place, indicating a significant improvement in its market position. February 2025 saw a further rise to 15th place, suggesting a continued positive momentum. However, by March 2025, the brand experienced a setback, dropping to 23rd place. This volatility suggests that while Rosin Tech has the capability to strengthen its market presence, it faces challenges in maintaining consistent upward movement.
The sales figures for Rosin Tech in California provide further insight into its performance trajectory. Despite the dip in ranking in March, Rosin Tech's sales in January and February were robust, with February 2025 sales showing an increase over January. This indicates that while the brand's ranking may have slipped, its sales figures reveal a more nuanced picture of its market performance. The absence of Rosin Tech from the top 30 in any other state or category underscores the brand's current focus on the California market, highlighting both a potential area for growth and a dependency on a single market for its sales.
Competitive Landscape
In the California concentrates market, Rosin Tech experienced notable fluctuations in its ranking from December 2024 to March 2025, reflecting a dynamic competitive landscape. Initially ranked 27th in December 2024, Rosin Tech climbed to 17th and then 15th in January and February 2025, respectively, before dropping to 23rd in March 2025. This upward trajectory in the early months indicates a strong performance, likely driven by increased sales, which peaked in February 2025. However, the decline in March suggests competitive pressures from brands like Have Hash, which rebounded to 21st place after a dip, and Buddies, which maintained a steady improvement in sales. Additionally, Mountain Man Melts showed resilience by recovering its rank to 22nd in March. These shifts highlight the importance for Rosin Tech to innovate and adapt to maintain its competitive edge in this volatile market.

Notable Products
In March 2025, Rosin Tech's top-performing product was Candied Oranges Cold Cure Live Rosin (1g) in the Concentrates category, securing the first position with sales reaching 1250 units. Orange Cream Pop Hash Infused Pre-Roll (1g) closely followed in second place, maintaining a strong presence in the Pre-Roll category. Diamond Dallas Hash Infused Pre-Roll (1g) improved its ranking from fifth in February to third in March, showcasing notable growth with sales increasing to 892 units. Jelly Donut Hash Infused Pre-Roll (1g) debuted in fourth place, while Truffle Butter Hash Infused Pre-Roll (1g) dropped from fourth to fifth position. Overall, the Pre-Roll category demonstrated dynamic shifts, with several products exchanging ranks month over month.
Top Selling Cannabis Brands
Data for this report comes from real-time sales reporting by participating cannabis retailers via their point-of-sale systems, which are linked up with Headset’s business intelligence software. Headset’s data is very reliable, as it comes digitally direct from our partner retailers. However, the potential does exist for misreporting in the instance of duplicates, incorrectly classified products, inaccurate entry of products into point-of-sale systems, or even simple human error at the point of purchase. Thus, there is a slight margin of error to consider. Brands listed on this page are ranked in the top twenty within the market and product category by total retail sales volume.

