Jul-2024
Sales
Trend
6-Month
Product Count
SKUs
Overview
Market Insights Snapshot
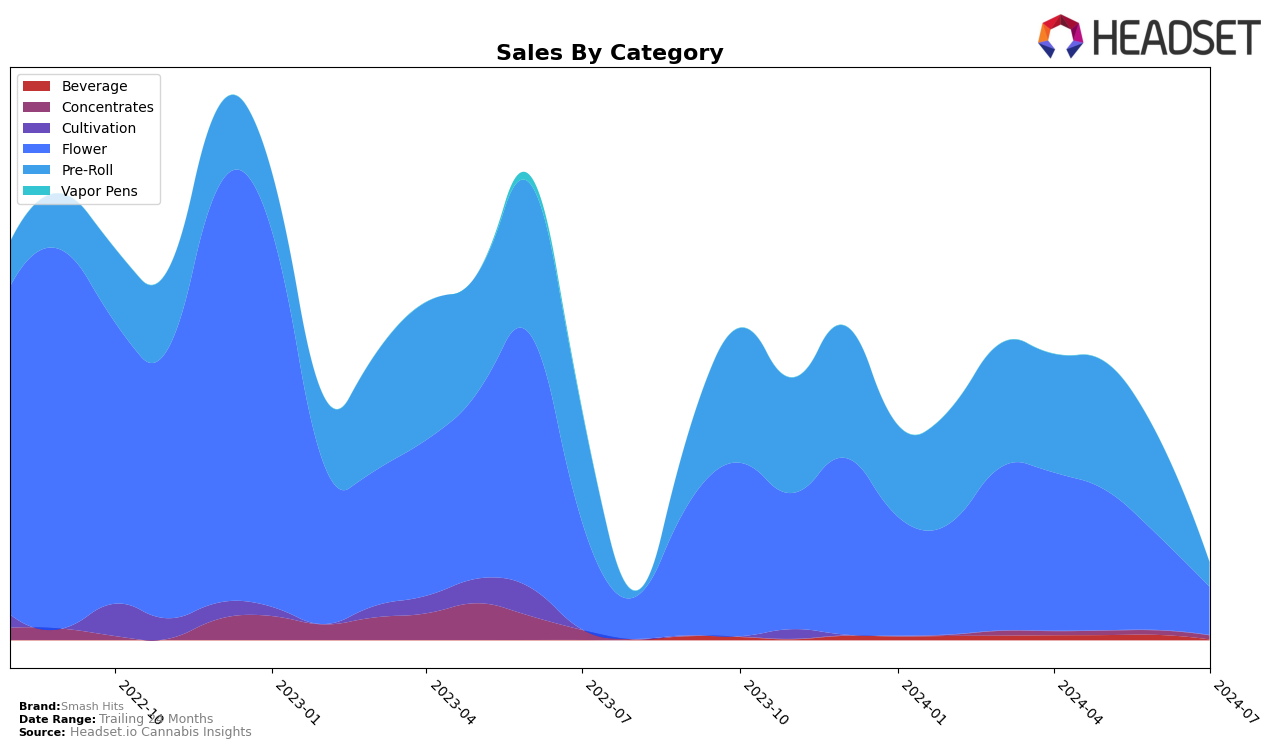
The performance of Smash Hits in Massachusetts has shown a notable decline across both Flower and Pre-Roll categories over the past few months. In the Flower category, the brand experienced a significant drop from a rank of 47 in April 2024 to 84 by July 2024. This downward trend is mirrored in their sales figures, which decreased from $292,287 in April to $88,734 in July. The Pre-Roll category also saw a similar decline, with the brand dropping out of the top 30 by July 2024, indicating a substantial loss in market presence. This could be a concerning indicator for the brand's overall market strategy and consumer retention in the state.
Smash Hits' decline in the Pre-Roll category in Massachusetts is particularly noteworthy. Starting at rank 21 in April 2024, the brand fell to 79 by July 2024, showing a sharp decrease in consumer preference or competitive positioning. The sales numbers reflect this trend, with a drop from $218,679 in April to just $44,531 in July. The absence of Smash Hits from the top 30 rankings in any category by July suggests that the brand is facing significant challenges in maintaining its market share. This data highlights the importance of continuous market analysis and adaptive strategies to counteract such declines.
Competitive Landscape
In the Massachusetts flower category, Smash Hits has experienced notable fluctuations in rank and sales over the past few months. Starting at rank 47 in April 2024, Smash Hits saw a decline to rank 84 by July 2024. This downward trend in rank is mirrored by a significant drop in sales, from $292,287 in April to $88,734 in July. Competitors like Sparq Cannabis Company and Curaleaf have also shown varying performance, with Sparq Cannabis Company starting at rank 42 in April and dropping to 81 by July, while Curaleaf improved its position from being unranked in May to rank 77 in July. Sanctuary Medicinals and Green Gold Group have also seen declines, but not as steep as Smash Hits. These trends suggest that while the overall market is volatile, Smash Hits may need to reassess its strategies to regain its competitive edge and improve sales performance.

Notable Products
In July 2024, the top-performing product from Smash Hits was Doctor Durban Infused Soda (5mg THC, 12oz) in the Beverage category, maintaining its first-place ranking from June. Chocolate Peaches (3.5g) in the Flower category rose to the second position, showing a slight drop in sales figures to 844 units. Chemdog S1 Pre-Roll (1g) debuted in third place in the Pre-Roll category with notable sales of 499 units. Zour Diesel (3.5g) and Chile Colombian Gold (3.5g), both in the Flower category, secured fourth and fifth places, respectively. Notably, Doctor Durban Infused Soda's sales figures have seen a significant decline from June's peak of 4571 units to 953 units in July.
Top Selling Cannabis Brands
Data for this report comes from real-time sales reporting by participating cannabis retailers via their point-of-sale systems, which are linked up with Headset’s business intelligence software. Headset’s data is very reliable, as it comes digitally direct from our partner retailers. However, the potential does exist for misreporting in the instance of duplicates, incorrectly classified products, inaccurate entry of products into point-of-sale systems, or even simple human error at the point of purchase. Thus, there is a slight margin of error to consider. Brands listed on this page are ranked in the top twenty within the market and product category by total retail sales volume.


