Jan-2025
Sales
Trend
6-Month
Product Count
SKUs
Overview
Market Insights Snapshot
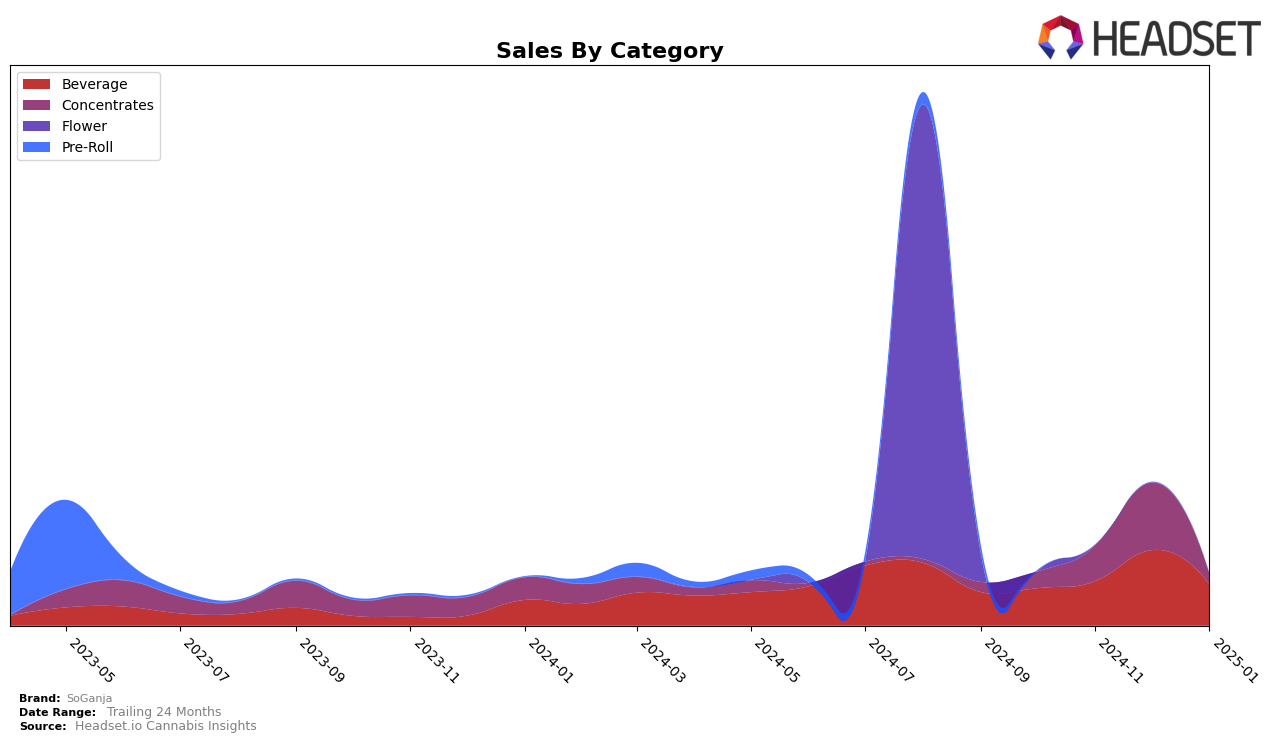
In the state of Missouri, SoGanja has shown notable performance in the Beverage category. Their ranking remained steady at 6th place in both October and November 2024, before climbing to 3rd place in December 2024, indicating a significant upward trend in consumer preference during the holiday season. However, by January 2025, the brand's ranking slipped back to 6th place, suggesting potential challenges in maintaining the momentum post-holidays. This fluctuation in rankings could be attributed to seasonal demand or competitive pressures. It's important to note that their sales figures in December 2024 nearly doubled compared to October, highlighting a peak in consumer interest during that period.
Conversely, in the Concentrates category, SoGanja's presence in Missouri is less prominent, as they did not rank within the top 30 brands in October 2024. However, they made an entry at 35th place in November and improved slightly to 33rd place by December 2024. The absence of a top 30 ranking in October suggests initial challenges in penetrating this market segment, but the subsequent improvement indicates a positive, albeit gradual, acceptance among consumers. This slow but upward trajectory may reflect strategic adjustments in their product offerings or marketing efforts within the Concentrates category. The data suggests there is potential for growth if the brand continues to refine its approach in this area.
Competitive Landscape
In the Missouri beverage category, SoGanja has experienced notable fluctuations in its market position over recent months, reflecting a dynamic competitive landscape. In December 2024, SoGanja achieved a significant boost, climbing to the 3rd rank, surpassing its typical 6th position seen in October and November 2024, as well as January 2025. This temporary ascent can be attributed to a surge in sales, which positioned SoGanja ahead of brands like High Five (MO), which consistently held the 5th rank. However, SoGanja's sales momentum was not sustained into January 2025, resulting in a drop back to the 6th rank, likely due to the resurgence of competitors such as Ripple (formerly Stillwater Brands), which saw a decline to the 7th position in January. Meanwhile, Drink Loud maintained a strong presence, despite not ranking in January, indicating a potential shift in market dynamics. These shifts highlight the importance of strategic positioning and adaptability for SoGanja to capitalize on market opportunities and sustain its competitive edge.

Notable Products
In January 2025, the top-performing product from SoGanja was the Galactic Grape Live Resin Soda (25mg), which climbed to the number one spot despite a decrease in sales to 722 units. Blue Buzzberry Soda (25mg THC, 12oz) fell to second place, showing a notable decline in sales compared to its leading position in December 2024. The Starberry Cream Live Resin Soda (25mg) maintained the third rank, continuing its downward trend in sales over the past few months. Rocket Rootbeer Giddy Up Live Rosin Soda (25mg) remained in fourth place, with a significant drop in sales to just 107 units. A new entry in the rankings, Wifi Cookies Live Resin (1g), debuted at fifth place, indicating potential growth in the Concentrates category.
Top Selling Cannabis Brands
Data for this report comes from real-time sales reporting by participating cannabis retailers via their point-of-sale systems, which are linked up with Headset’s business intelligence software. Headset’s data is very reliable, as it comes digitally direct from our partner retailers. However, the potential does exist for misreporting in the instance of duplicates, incorrectly classified products, inaccurate entry of products into point-of-sale systems, or even simple human error at the point of purchase. Thus, there is a slight margin of error to consider. Brands listed on this page are ranked in the top twenty within the market and product category by total retail sales volume.

