Nov-2025
Sales
Trend
6-Month
Product Count
SKUs
Overview
Market Insights Snapshot

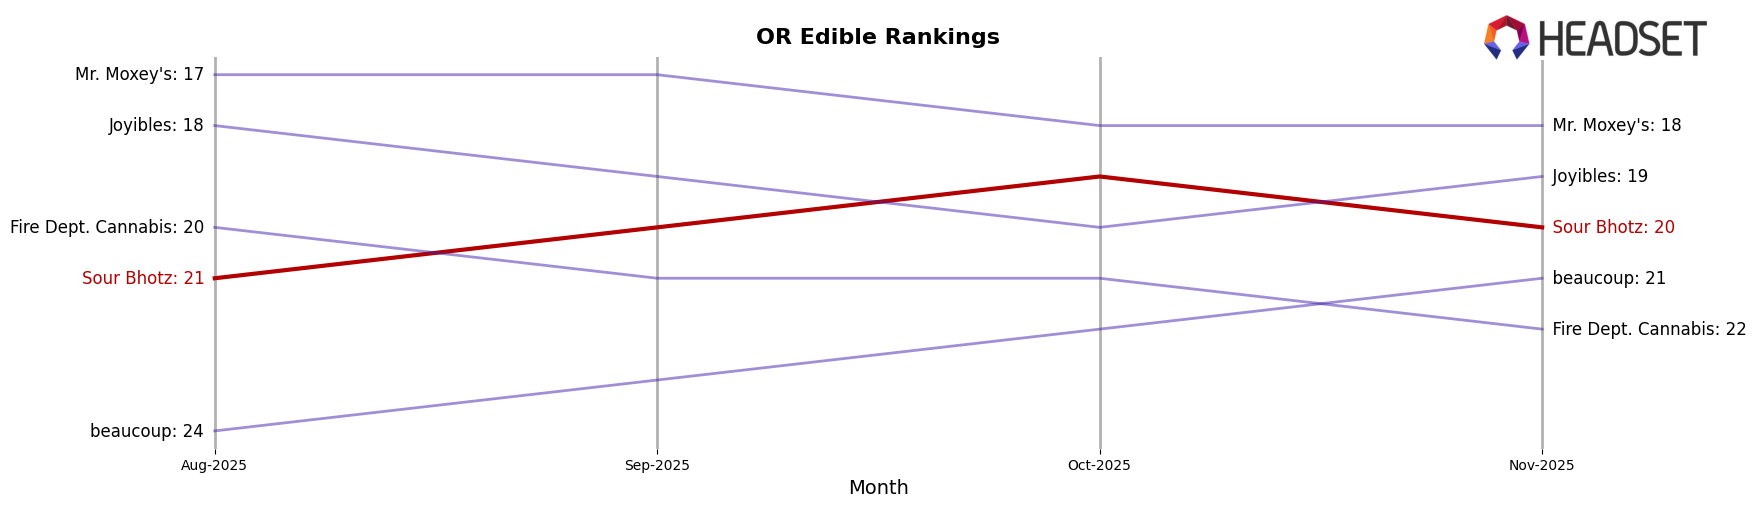
Sour Bhotz has shown a consistent presence in the Oregon edibles market, maintaining a rank within the top 30 brands throughout the past few months. Specifically, the brand improved its position from 21st in August 2025 to 19th in October 2025, before slightly dropping back to 20th in November. This fluctuation suggests a competitive landscape in the edibles category, where maintaining a steady rank is indicative of a strong brand presence. Interestingly, while the brand's ranking improved in October, its sales peaked that month, reaching $50,241, before declining in November, which may suggest a seasonal or marketing-driven spike in consumer interest during October.
Despite the competitive nature of the market, Sour Bhotz's ability to stay within the top 30 in Oregon indicates a robust consumer base and effective market strategies. The fact that they are consistently ranked is a positive indicator of brand stability, especially when considering that not all brands manage to maintain a top 30 position consistently. It's worth noting that while the brand has maintained a presence in Oregon, the absence of rankings in other states or provinces suggests that Sour Bhotz may either be focusing its efforts primarily in Oregon or facing challenges in expanding its market footprint beyond this state. This could present both a challenge and an opportunity for the brand moving forward, depending on their strategic goals and market dynamics.
Competitive Landscape
In the competitive landscape of the Oregon edible market, Sour Bhotz has experienced notable fluctuations in its ranking and sales performance from August to November 2025. Initially ranked 21st in August, Sour Bhotz improved to 19th in October before slipping back to 20th in November. This suggests a competitive struggle, particularly against brands like Joyibles, which maintained a relatively stable position around the 19th rank and saw a significant sales increase in November. Meanwhile, Mr. Moxey's consistently held a higher rank than Sour Bhotz, despite a sales decline, indicating strong brand loyalty or market presence. On the other hand, beaucoup demonstrated a positive upward trend, moving from 24th to 21st, which could pose a future threat to Sour Bhotz's market share. The competitive dynamics highlight the need for Sour Bhotz to innovate or enhance its marketing strategies to regain and sustain a higher rank in this evolving market.
Notable Products
In November 2025, the top-performing product from Sour Bhotz was the Baja Blasted Gummy (100mg) in the Edible category, maintaining its first-place position with sales reaching 2780 units. The Tangerine Gummy (100mg) showed significant improvement, climbing from fifth place in October to second in November, with sales of 1809 units. The Sour Apple Gummy (100mg) also gained traction, moving up to third place from fourth the previous month. The Pineapple Gummy (100mg) entered the rankings in November at the fourth position. Meanwhile, the Blue Razz Gummy (100mg) slipped to fifth place after previously ranking first in September, indicating a notable decline in its sales momentum.
Top Selling Cannabis Brands
Data for this report comes from real-time sales reporting by participating cannabis retailers via their point-of-sale systems, which are linked up with Headset’s business intelligence software. Headset’s data is very reliable, as it comes digitally direct from our partner retailers. However, the potential does exist for misreporting in the instance of duplicates, incorrectly classified products, inaccurate entry of products into point-of-sale systems, or even simple human error at the point of purchase. Thus, there is a slight margin of error to consider. Brands listed on this page are ranked in the top twenty within the market and product category by total retail sales volume.

