Dec-2024
Sales
Trend
6-Month
Product Count
SKUs
Overview
Market Insights Snapshot
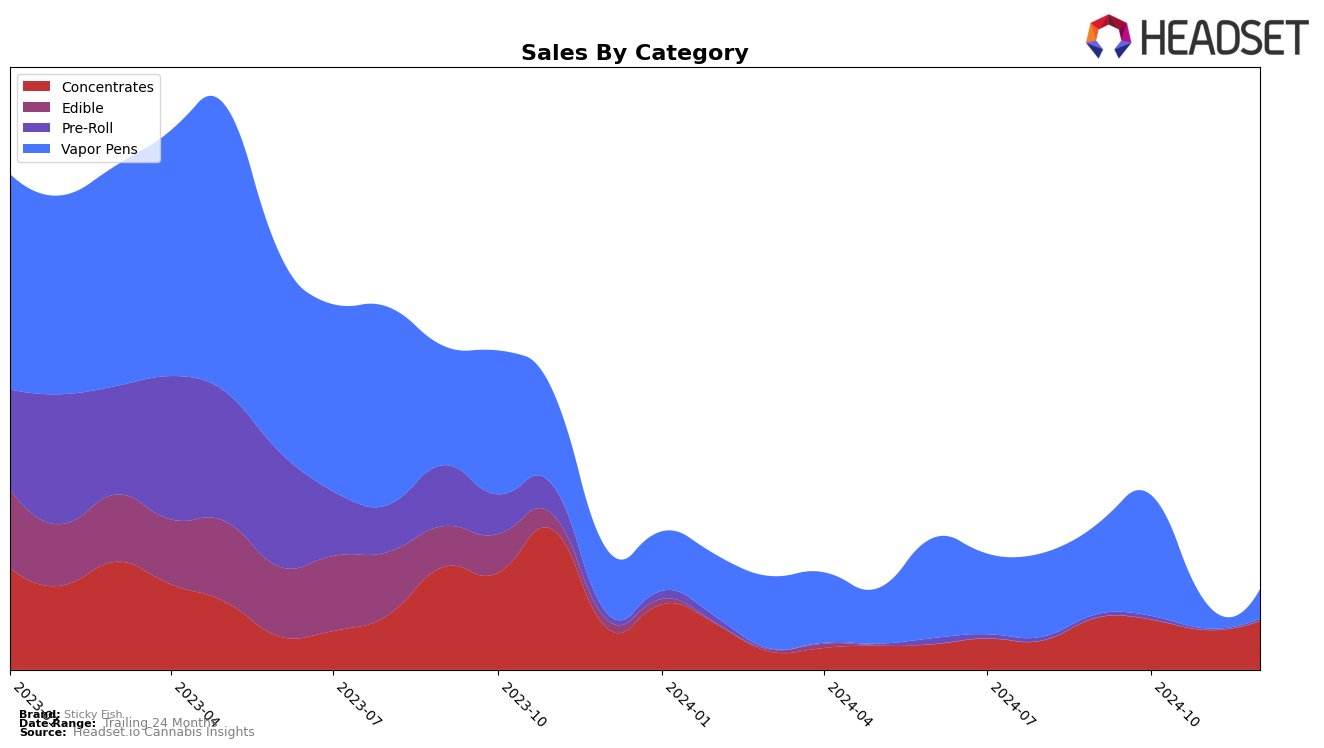
Sticky Fish has shown varied performance across different product categories and states. In the Concentrates category within Massachusetts, Sticky Fish has experienced some fluctuation in its rankings over the last few months. Starting at the 29th position in September 2024, the brand slightly fell out of the top 30 in October and November, before making a comeback to the 28th spot in December. This rebound indicates a positive trend, suggesting that the brand is regaining its foothold in the Concentrates market. However, the sales figures tell a slightly different story, with a noticeable dip in November before recovering in December, which signifies potential volatility in consumer demand or competitive pressures.
In contrast, the Vapor Pens category in Massachusetts paints a more challenging picture for Sticky Fish. The brand's ranking saw a significant drop from 58th in September to 99th in November, before slightly improving to the 89th position by December. This decline in rankings is accompanied by a sharp decrease in sales, particularly in November, which could indicate a loss of market share or shifting consumer preferences away from Sticky Fish's offerings in this segment. The absence from the top 30 in both November and December highlights the struggles faced by the brand in maintaining competitiveness in the Vapor Pens category. Such insights could suggest areas for strategic improvement to enhance Sticky Fish's market presence moving forward.
Competitive Landscape
In the Massachusetts concentrates market, Sticky Fish experienced a fluctuating rank from September to December 2024, moving from 29th to 28th position. This slight improvement in rank suggests a modest recovery in sales performance, particularly in December, following a dip in November. In comparison, Remedi consistently outperformed Sticky Fish, maintaining a higher rank throughout the period, despite a drop from 16th to 25th in November. Meanwhile, Natural Selections showed a steady climb from 37th to 26th, indicating a significant upward trend that could pose a future threat to Sticky Fish's market position. MPX - Melting Point Extracts and Dabl displayed more volatile rankings, with MPX dropping out of the top 30 in October and November before rebounding in December, and Dabl showing a notable surge in November. These dynamics highlight the competitive pressures Sticky Fish faces, emphasizing the need for strategic adjustments to maintain and enhance its market standing.

Notable Products
In December 2024, Sticky Fish's top-performing product was the Blue Dream x Sour Jack Live Resin Cartridge (0.5g) in the Vapor Pens category, achieving the number one rank with sales of 273 units. TT Sprinkles Cured Budder (0.5g) secured the second spot in the Concentrates category. Apple Tartz Live Budder (1g) dropped to third place from its peak at the top in November. Hash Jelly Live Budder (1g) maintained a consistent presence, ranking fourth in December. Notably, Dragon Glue Live Butter (0.5g) entered the top five, marking its debut in the rankings for the month.
Top Selling Cannabis Brands
Data for this report comes from real-time sales reporting by participating cannabis retailers via their point-of-sale systems, which are linked up with Headset’s business intelligence software. Headset’s data is very reliable, as it comes digitally direct from our partner retailers. However, the potential does exist for misreporting in the instance of duplicates, incorrectly classified products, inaccurate entry of products into point-of-sale systems, or even simple human error at the point of purchase. Thus, there is a slight margin of error to consider. Brands listed on this page are ranked in the top twenty within the market and product category by total retail sales volume.


