.svg)

Sep-2026
Sales
Trend
6-Month
Product Count
SKUs
Avg Price
YoY Sales Change
YoY Price Change


Where to Buy
Stingers is stocked at 309 licensed dispensaries across Washington, Massachusetts, and 3 other states, 184 of them in Washington, with the deepest coverage in Seattle, Tacoma, Spokane, Vancouver, and Everett. Search by ZIP code or city below to find the closest one, or filter by product type if you are after a specific format.
Market Insights Snapshot
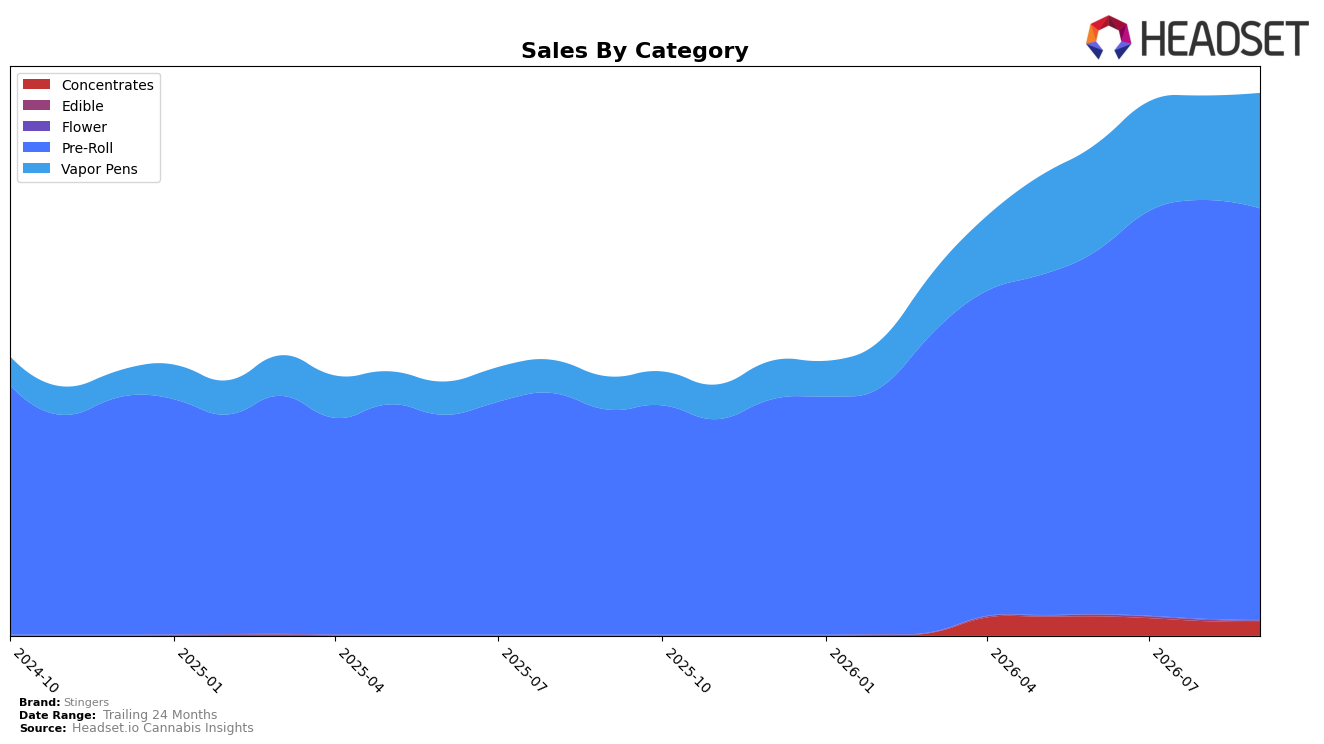
In September 2026, Stingers concentrated 76.00% of sales in Pre-Roll, where year-over-year growth was 83.05% despite a month-over-month dip of 1.75%, while Vapor Pens expanded to a 21.28% share with 250.23% year-over-year growth and a 10.56% month-over-month increase. The long tail contracted, with Concentrates at 2.51% share and down 5.19% month over month, and Edible and Flower shrinking month over month by 21.72% and 20.39% respectively. Average price rose 18.78% year over year against brand sales growth of 110.11% year over year, indicating mix-driven volume expansion rather than solely pricing. With a Pre-Roll category rank of 5 in Washington and Vapor Pens accelerating, the pattern implies reliance on a high-volume Pre-Roll base while the faster-growing Vapor Pens line is beginning to rebalance category risk.
The divergence between a -1.75% month-over-month decline in Pre-Roll and a 10.56% month-over-month gain in Vapor Pens suggests short-term trading of share toward higher-priced formats, reinforced by Vapor Pens’ 13.69 average price versus 8.32 in Pre-Roll. With Pre-Roll still at 76.00% share but Vapor Pens adding 250.23% year-over-year growth, the path implies maintaining a top-5 Pre-Roll position in Washington while shifting incremental investment to Vapor Pens to lift blended revenue per unit. Given brand-level sales up 110.11% year over year alongside category-level month-over-month softness in smaller segments (e.g., Concentrates down 5.19%), the mix points to durable scale anchored in Pre-Roll with margin leverage coming from the Vapor Pens expansion.
Competitive Landscape
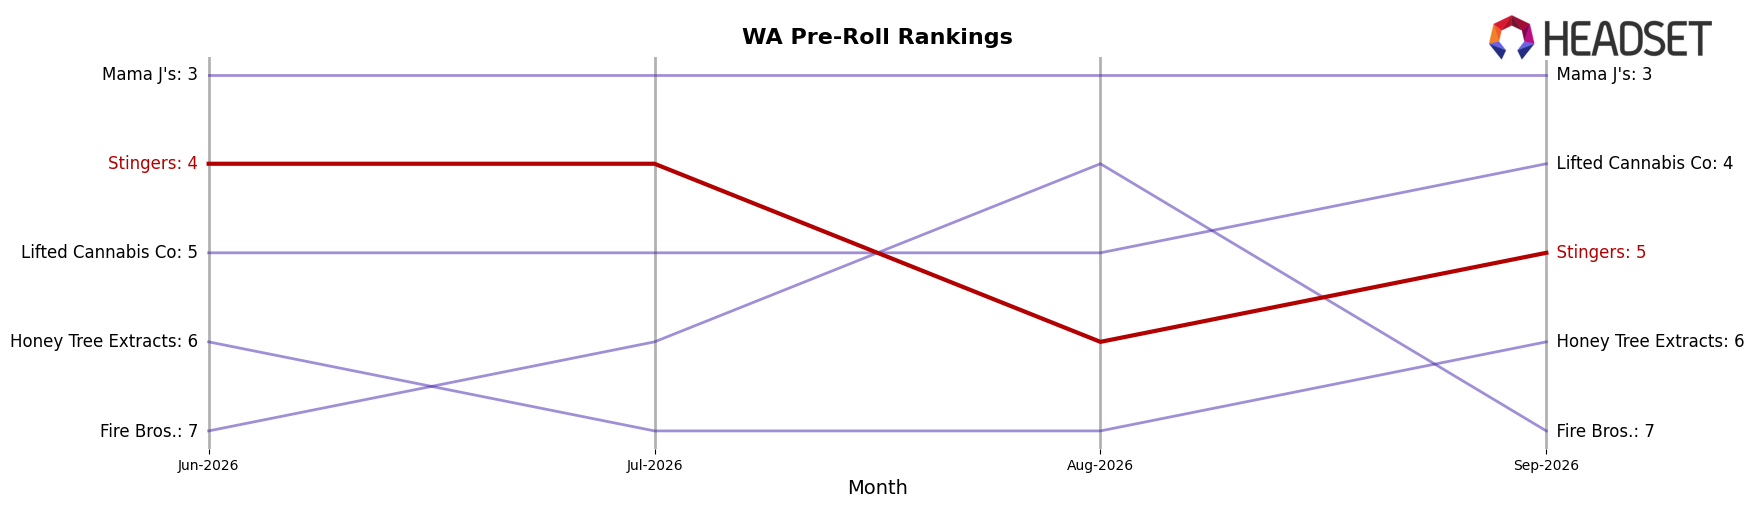
Stingers sits at rank #5 in WA Pre-Roll in September 2026, down one spot from #4 year over year and down one from its July 2026 peak at #4, while rival Ooowee holds #1 with a 57.7% YoY sales increase and Lifted Cannabis Co improved from #5 YoY to #4 with 16.4% YoY growth; meanwhile, Phat Panda stays at #2 with 7.6% YoY growth and Mama J's remains #3 with 53.6% YoY growth. With Stingers slipping from #4 in July 2026 to #5 in September 2026 and competitors either holding or climbing, the pattern implies Stingers must outpace mid-teen to 50%+ growth cohorts to regain a top-4 position.
Notable Products
Pineapple Express Infused Pre-Roll (1g) posted the steepest movement in September 2026 with a -29.9% month-over-month decline and slipped to rank 3, while Green Apple Crack Liquid Diamonds Infused Pre-Roll (1g) fell -33.4% and sat at rank 9. Offsetting the pullback at the top end, Strawberry Jelly Liquid Diamonds Terps Infused Pre-Roll (1g) jumped +42.5% month over month to take rank 1, and Sweets Winter Mint Infused Pre-Roll (1g) rose +32.5% to rank 4. All top-10 SKUs are Pre-Rolls, and the mix skews toward infused variants, indicating Stingers is consolidating around terp- and flavor-driven formats even as volatility in legacy flavors reshuffles share; the implication is a pivot to premiumized infused offerings rather than breadth expansion.
Top Selling Cannabis Brands






Data for this report comes from real-time sales reporting by participating cannabis retailers via their point-of-sale systems, which are linked up with Headset’s business intelligence software. Headset’s data is very reliable, as it comes digitally direct from our partner retailers. However, the potential does exist for misreporting in the instance of duplicates, incorrectly classified products, inaccurate entry of products into point-of-sale systems, or even simple human error at the point of purchase. Thus, there is a slight margin of error to consider. Brands listed on this page are ranked in the top twenty within the market and product category by total retail sales volume.

