Jun-2026
Sales
Trend
6-Month
Product Count
SKUs
Avg Price
YoY Sales Change
YoY Price Change
Market Insights Snapshot
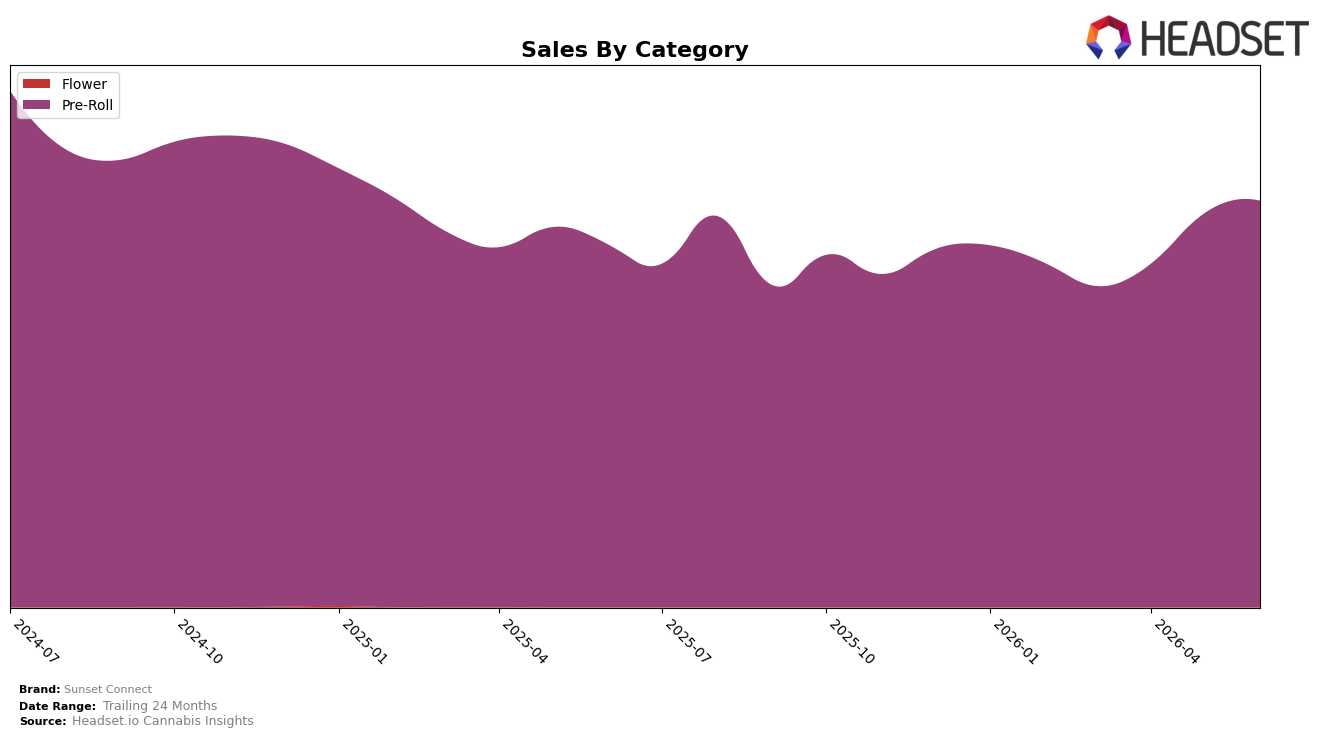
In June 2026, Sunset Connect remained a single-category brand with Pre-Roll at 100.0% of sales, posting year-over-year growth of 12.1% and month-over-month growth of 3.2%. Average price decreased 0.8% year over year while maintaining a $4.32 unit level, and the Pre-Roll rank in California stood at 20 within the category. The pattern implies a volume-led expansion in Pre-Rolls where modest pricing deflation alongside a mid-pack rank suggests gains are coming from mix depth rather than cross-category breadth.
With all sales concentrated in Pre-Roll and a category rank of 20 in California, the 12.1% year-over-year lift against a 3.2% month-over-month uptick indicates recurring demand rather than a one-off spike. The 0.8% price decline paired with 100.0% category reliance points to a value-leaning position within Pre-Roll, implying Sunset Connect is trading share through accessible price points and operational consistency rather than premium-tier differentiation.
Competitive Landscape
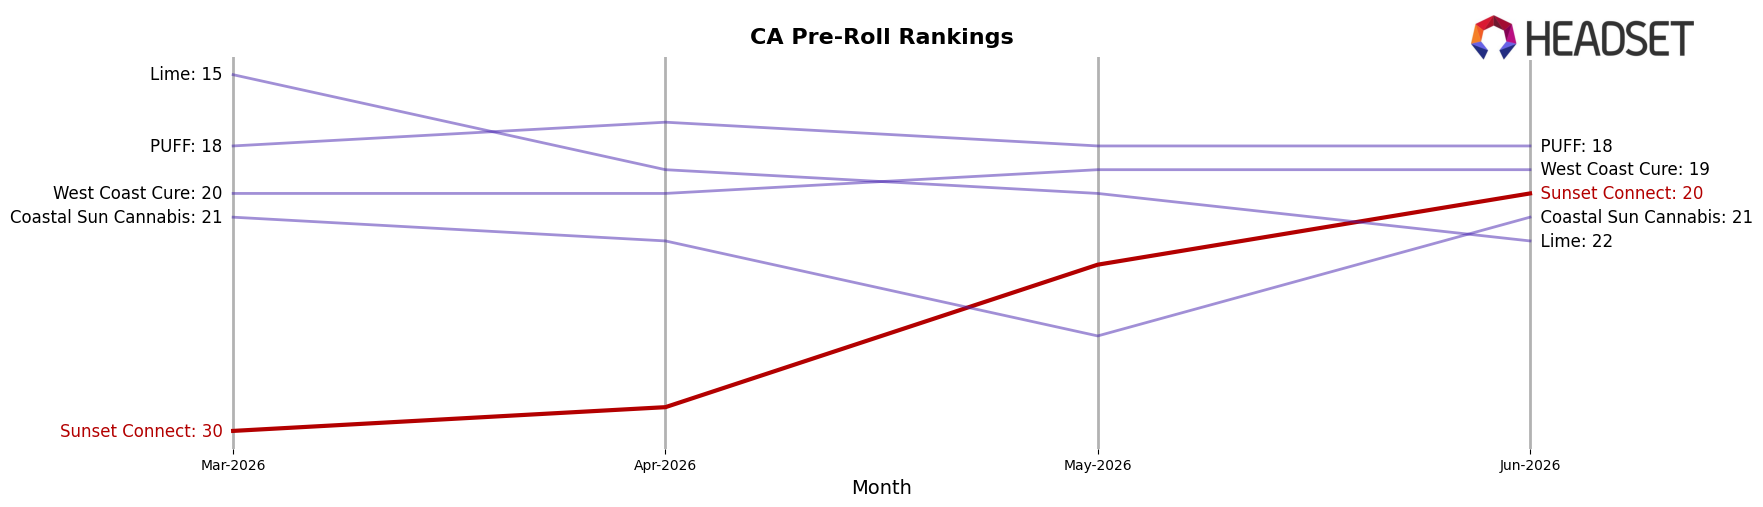
Sunset Connect sits at rank #20 in CA Pre-Roll in June 2026, improving 3 positions year over year from #23 and climbing 10 places since March 2026 from #30, while still trailing its historical peak of #19 from February 2025 by 1 position; by contrast, CannaBiotix (CBX) advanced from #7 to #4 year over year and Jeeter held #1 with a 66% sales increase, indicating that Sunset Connect’s steady rank gains are outpaced by top-tier momentum and signal a need to convert short-term rank recovery into sustained share capture.
Notable Products
Tio Franky Pre-Roll (1g) led the movement with a -15.2% month-over-month decline and still held rank 2, while Purple Rainbow Pre-Roll (1g) climbed 41.5% month-over-month to rank 1. Royal Grapes Pre-Roll (1g) added a 39.5% month-over-month gain at rank 4, and three of the top five SKUs posted positive growth while one contracted by double digits. With ten of the top ten in Pre-Roll and a single product driving a -15.2% pullback alongside two 39%+ risers, the mix points to a concentration bet on a narrow format where volatility in a few hero SKUs can swing monthly revenue direction even with a $44,582 leader.
Top Selling Cannabis Brands
Data for this report comes from real-time sales reporting by participating cannabis retailers via their point-of-sale systems, which are linked up with Headset’s business intelligence software. Headset’s data is very reliable, as it comes digitally direct from our partner retailers. However, the potential does exist for misreporting in the instance of duplicates, incorrectly classified products, inaccurate entry of products into point-of-sale systems, or even simple human error at the point of purchase. Thus, there is a slight margin of error to consider. Brands listed on this page are ranked in the top twenty within the market and product category by total retail sales volume.

