Mar-2025
Sales
Trend
6-Month
Product Count
SKUs
Overview
Market Insights Snapshot
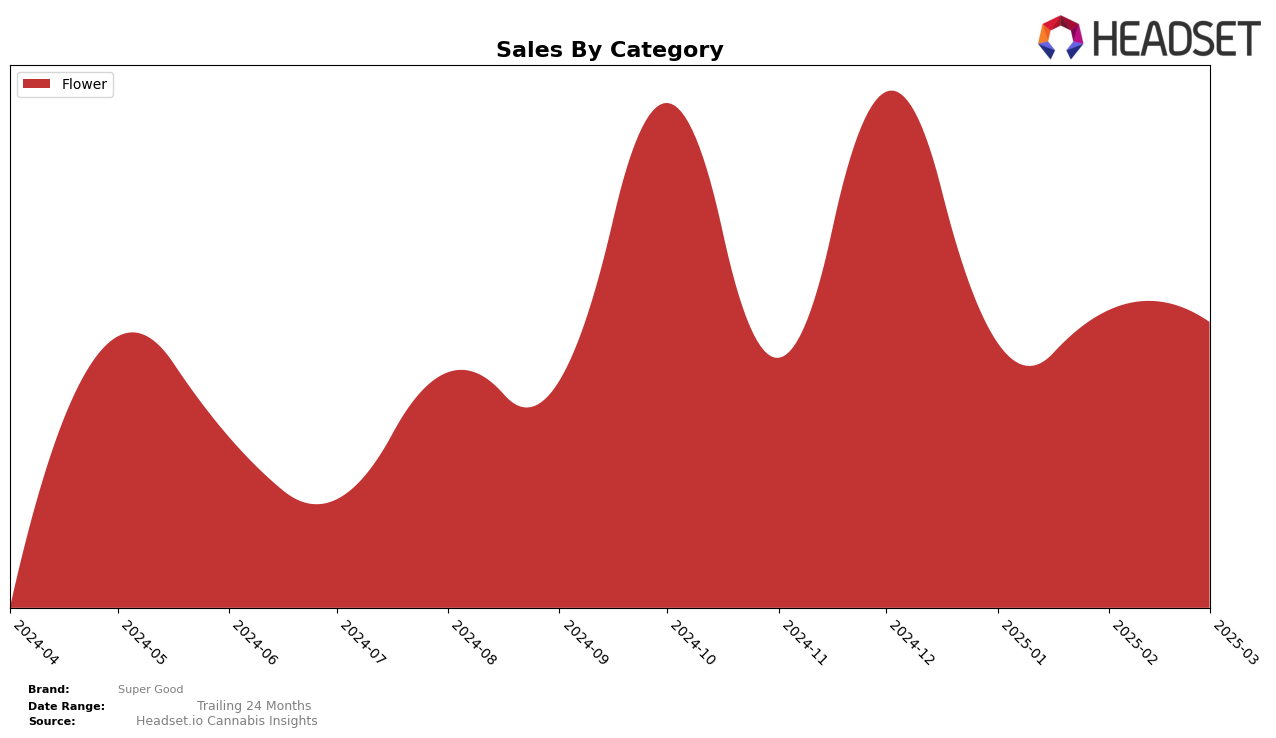
Super Good has shown varied performance across different categories and states, with notable fluctuations in their rankings. In Nevada, the brand's presence in the Flower category has experienced some shifts. Starting at a rank of 14 in December 2024, Super Good saw a decline to 26 in January 2025, before slightly improving to rank 24 in both February and March 2025. This suggests a recovery in the latter months, although they did not break into the top 20 again. The movement indicates some volatility in their market position, which could be attributed to competitive pressures or changes in consumer preferences within the state.
It's important to note that while Super Good did maintain a presence within the top 30 in Nevada's Flower category throughout the observed period, their absence from the top 30 in other categories or states highlights potential areas for growth or concern. The consistency in maintaining a rank within the top 30 in Nevada suggests a stable consumer base, but the lack of presence in other markets or categories could indicate untapped potential or challenges in market penetration. The trend in Nevada, where sales slightly decreased from January to March despite a stable ranking, might point to external factors affecting consumer spending or market dynamics. This information provides a glimpse into the brand's performance, leaving room for further exploration into their strategies and market conditions.
Competitive Landscape
In the competitive landscape of the Nevada flower market, Super Good has experienced notable fluctuations in its ranking, which could impact its sales trajectory. Starting from December 2024, Super Good was ranked 14th, but it saw a decline to 26th in January 2025, before stabilizing at 24th in both February and March 2025. This decline in rank coincides with a decrease in sales from December to January, although sales slightly recovered in the following months. In contrast, CAMP (NV) showed a strong performance, peaking at 7th in February 2025, which may have drawn market share away from Super Good. Meanwhile, Khalifa Kush maintained a relatively stable position, hovering around the 19th to 23rd rank, indicating consistent consumer preference. The competitive dynamics suggest that Super Good needs to strategize effectively to regain its higher rank and capitalize on the growing market demand.

Notable Products
In March 2025, Peanut Butter Souffle (14g) from Super Good emerged as the top-performing product, achieving the number one rank with notable sales of 659 units. OG Diesel (14g) climbed to the second position, showing a significant improvement from its absence in February, with sales reaching 569 units. Ruby Red (14g) secured the third spot, followed by Mad Fruit (14g) in fourth, both making their first appearance in the top rankings for the year. Pink Runtz (14g) experienced a slight drop, falling from fourth in February to fifth in March, but maintained a consistent presence in the top five throughout the months. Overall, March saw a dynamic shift in product rankings, with new entries and changes in positions compared to previous months.
Top Selling Cannabis Brands
Data for this report comes from real-time sales reporting by participating cannabis retailers via their point-of-sale systems, which are linked up with Headset’s business intelligence software. Headset’s data is very reliable, as it comes digitally direct from our partner retailers. However, the potential does exist for misreporting in the instance of duplicates, incorrectly classified products, inaccurate entry of products into point-of-sale systems, or even simple human error at the point of purchase. Thus, there is a slight margin of error to consider. Brands listed on this page are ranked in the top twenty within the market and product category by total retail sales volume.

