Mar-2025
Sales
Trend
6-Month
Product Count
SKUs
Overview
Market Insights Snapshot
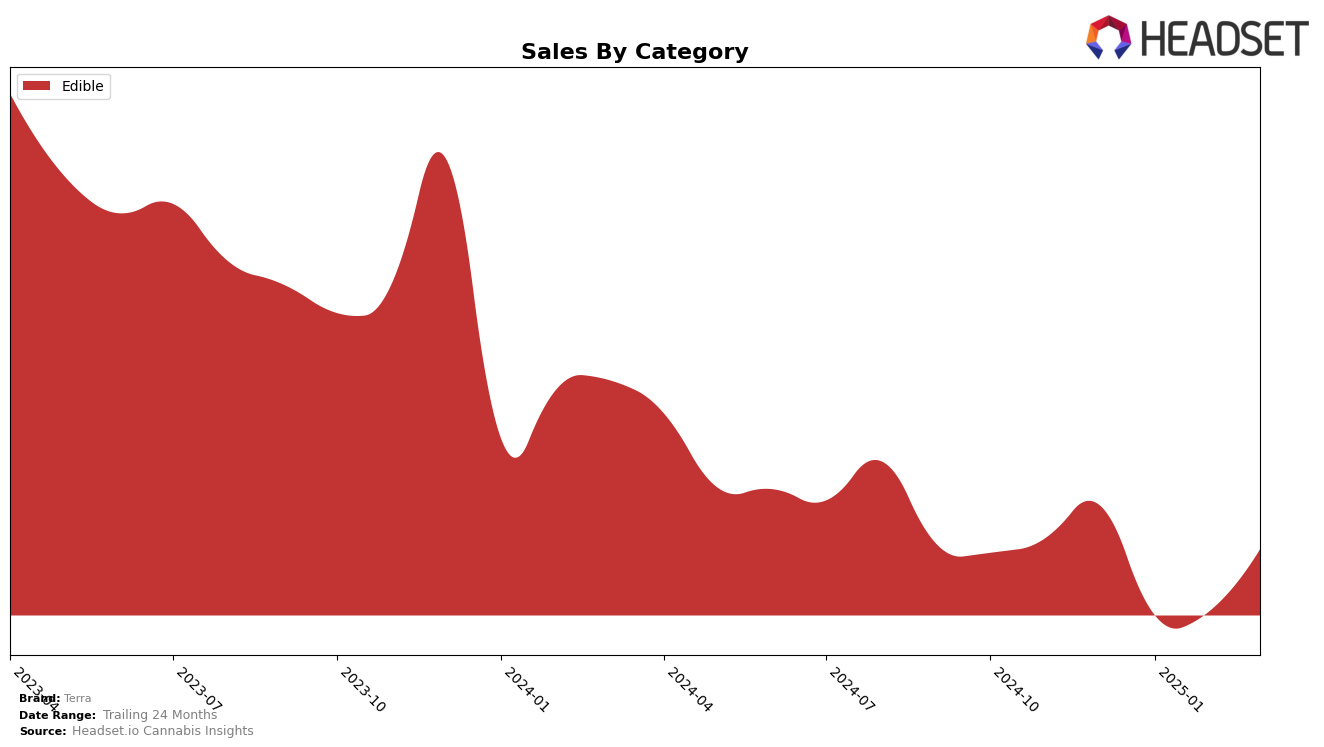
Terra's performance in the edible category has shown varied results across different states. In California, Terra maintained a stable presence, consistently ranking in the mid-20s from December 2024 to March 2025, with a slight increase in sales by March. This steady position highlights its resilience in a competitive market. In contrast, Illinois saw Terra hovering around the mid-30s, with a minor dip in February before recovering slightly in March. Meanwhile, in Massachusetts, Terra experienced a downward trend, falling from 39th in December to 48th by March, indicating challenges in maintaining its market share.
In Michigan, Terra's performance showed a positive trajectory, climbing from 47th in December to 44th by March, suggesting a growing acceptance or demand for its products in this region. On the other hand, Arizona did not see Terra breaking into the top 30, which could be a sign of either a highly competitive market or a need for stronger market penetration strategies. In Ohio, Terra's presence was sporadic, missing from the top rankings in January but reappearing in February and March, suggesting fluctuations in consumer interest or availability issues. These movements indicate the diverse challenges and opportunities Terra faces across different states, reflecting both its strengths and areas needing improvement.
Competitive Landscape
In the competitive landscape of the California edible market, Terra has experienced fluctuations in its ranking, with a notable dip from 21st place in December 2024 to 25th in January 2025, before stabilizing at 24th in February and March 2025. This volatility in rank is mirrored by its sales performance, which saw a decline from December to January, followed by a gradual recovery in the subsequent months. Competitors such as Zen Cannabis and Space Gem have shown more consistent rankings, with Zen Cannabis maintaining a steady presence in the top 23 and Space Gem rebounding to 22nd place by March 2025. Meanwhile, Punch Extracts / Punch Edibles and Whoa Infused have struggled to break into the top 20, with Whoa Infused consistently ranking below Terra. These dynamics suggest that while Terra faces challenges in maintaining its market position, its ability to recover sales in the early months of 2025 indicates potential for regaining competitive ground.

Notable Products
In March 2025, Terra's top-performing product remained the Milk Chocolate Sea Salt Caramel Bites 20-Pack in the Edible category, holding the number one rank consistently from December 2024 through March 2025, with a sales figure of 9,923 units. The Dark Chocolate Espresso Bean Bites 20-Pack also maintained its second position across the same period, indicating stable consumer preference. Blueberry Milk Chocolate Bites 20-Pack continued to secure the third spot, showing no change in its ranking over the months. The THC/CBN 5:2 Milk And Cookies Chocolate Bites 20-Pack and CBD/THC 1:1 Dark Chocolate Covered Almonds Bites 20-Pack held steady at fourth and fifth ranks, respectively, throughout the observed months. Overall, Terra's product rankings displayed remarkable consistency in March 2025, with no shifts in the top five positions compared to prior months.
Top Selling Cannabis Brands
Data for this report comes from real-time sales reporting by participating cannabis retailers via their point-of-sale systems, which are linked up with Headset’s business intelligence software. Headset’s data is very reliable, as it comes digitally direct from our partner retailers. However, the potential does exist for misreporting in the instance of duplicates, incorrectly classified products, inaccurate entry of products into point-of-sale systems, or even simple human error at the point of purchase. Thus, there is a slight margin of error to consider. Brands listed on this page are ranked in the top twenty within the market and product category by total retail sales volume.

