Mar-2024
Sales
Trend
6-Month
Product Count
SKUs
Overview
Market Insights Snapshot
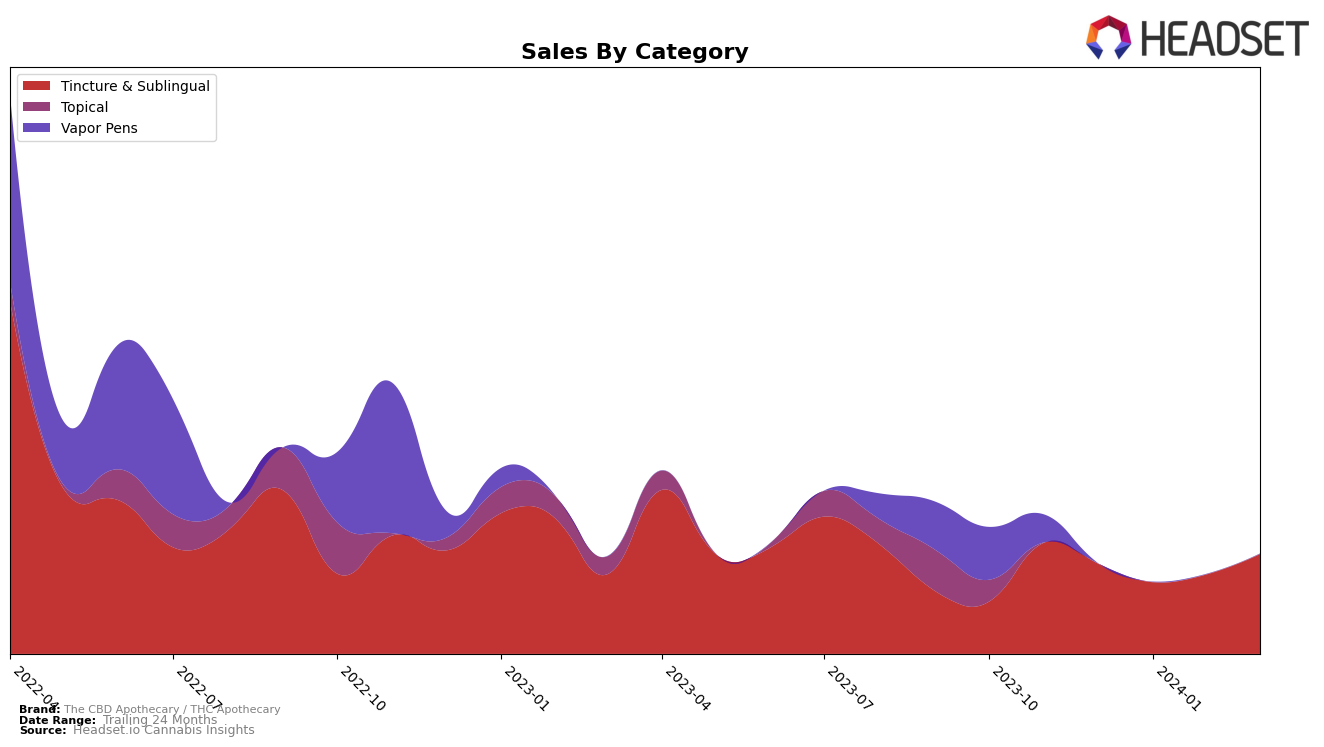
In the tincture and sublingual category within Oregon, The CBD Apothecary / THC Apothecary has demonstrated a noteworthy performance, maintaining a presence in the top 20 brands over a four-month period. The brand's ranking has shown slight fluctuations, moving from the 20th position in December 2023 to 19th in January 2024, dipping back to 20th in February, and then improving to 18th by March 2024. This upward movement in March, despite the competitive landscape, suggests a positive consumer reception and an increasing market share within the state of Oregon. The sales figures, starting at $4,100 in December 2023 and peaking at $4,526 by March 2024, underscore a growing consumer interest and a potential strengthening of the brand's market position in the tincture and sublingual category.
However, the fluctuation in rankings, while relatively minor, indicates a competitive pressure within the tincture and sublingual market in Oregon. The initial drop in sales from December 2023 to January 2024, followed by a recovery and eventual growth by March 2024, suggests that The CBD Apothecary / THC Apothecary is navigating through market challenges effectively, possibly by enhancing product offerings or marketing strategies. The brand's ability to not only regain its initial position but also to climb up two spots in a competitive environment is commendable. Despite these movements, the brand's consistent presence in the top 30 across these months signals a stable consumer base and hints at the brand's resilience and potential for further growth in the Oregon market.
Competitive Landscape
In the competitive landscape of the Tincture & Sublingual category in Oregon, The CBD Apothecary / THC Apothecary has experienced fluctuations in its market position, indicating a dynamic and competitive market. From December 2023 to March 2024, it saw a slight improvement in rank, moving from 20th to 18th, despite a dip in sales in January 2024 before recovering in the following months. Its competitors, such as THClear Co, have shown more significant rank improvements and sales growth, moving from 18th to 17th rank with a notable sales peak in February 2024. Meanwhile, TJ's Gardens and Elysium Fields have also seen rank changes but with varying sales trends, indicating a competitive push and pull among these brands. Notably, Liquid Gold made a significant leap into the top 20 by March 2024, showcasing the dynamic nature of consumer preferences and market entries. This competitive analysis underscores the importance for The CBD Apothecary / THC Apothecary to innovate and adapt to maintain and improve its market position amidst these shifts.

Notable Products
In March 2024, The CBD Apothecary / THC Apothecary saw its "CBN/CBD/THC/CBG 1:1:1:1 Full Spectrum Cannabis Infused Coconut Oil Tincture" maintain its top position for the fourth consecutive month, with a notable sales figure of 123 units. The "CBN/CBD 1:1 Comfort Tincture" held steady at second place, despite a decrease in sales from previous months. The "THC/CBN 1:1 Sleep Tincture" was previously ranked third but did not make the sales chart for March, indicating a shift in consumer preference or stock issues. This change highlights the dynamic nature of product popularity within the cannabis industry. Overall, The CBD Apothecary / THC Apothecary's product lineup shows a strong preference for tinctures, particularly those with balanced cannabinoid profiles.
Top Selling Cannabis Brands
Data for this report comes from real-time sales reporting by participating cannabis retailers via their point-of-sale systems, which are linked up with Headset’s business intelligence software. Headset’s data is very reliable, as it comes digitally direct from our partner retailers. However, the potential does exist for misreporting in the instance of duplicates, incorrectly classified products, inaccurate entry of products into point-of-sale systems, or even simple human error at the point of purchase. Thus, there is a slight margin of error to consider. Brands listed on this page are ranked in the top twenty within the market and product category by total retail sales volume.


