Mar-2025
Sales
Trend
6-Month
Product Count
SKUs
Overview
Market Insights Snapshot
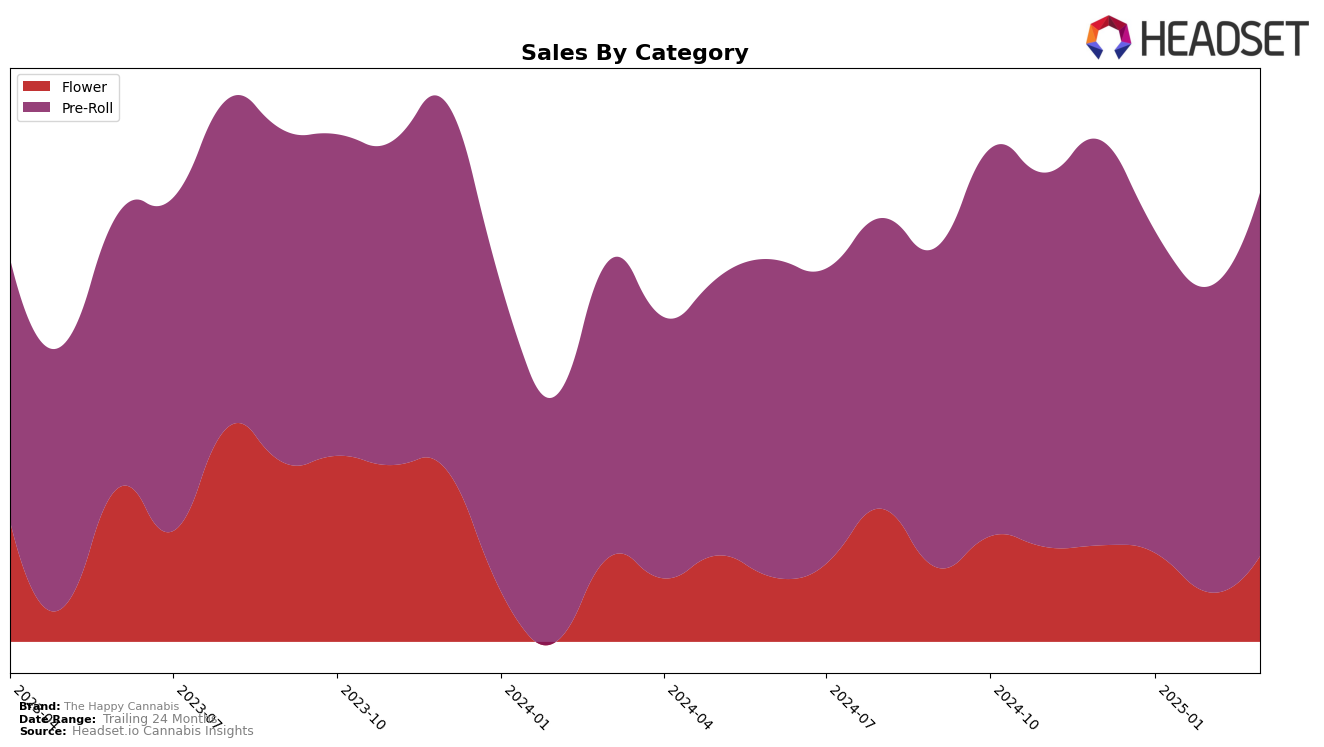
The Happy Cannabis has shown varied performance across different categories and states. In the Washington market, their Flower category has experienced fluctuations in its ranking, indicating a competitive landscape. Starting at rank 58 in December 2024, the brand improved slightly to 56 in January 2025, but dropped out of the top 60 in February, only to bounce back to 53 in March. This suggests some volatility, possibly due to market conditions or internal strategic adjustments. The brand's sales in this category also reflect these movements, with a noticeable dip in February but a recovery by March, highlighting the challenges of maintaining a consistent presence in the top rankings.
In contrast, The Happy Cannabis has maintained a more stable performance in the Pre-Roll category in Washington. The brand consistently ranked within the top 10 from December 2024 to March 2025, peaking at rank 8 in December and maintaining a strong position at rank 9 by March. This consistent ranking suggests a strong foothold in the Pre-Roll category, potentially driven by consumer loyalty or effective marketing strategies. Despite a dip in sales in January and February, the brand managed to recover by March, indicating resilience and possibly effective promotional efforts or product innovations that resonated with consumers. This stability in the Pre-Roll category contrasts with the more erratic performance seen in the Flower category, highlighting the brand's varied success across different product lines.
Competitive Landscape
In the competitive landscape of the Pre-Roll category in Washington, The Happy Cannabis experienced notable fluctuations in its ranking and sales performance from December 2024 to March 2025. Initially ranked 8th in December 2024, The Happy Cannabis saw a dip to 10th place in January and February 2025, before slightly recovering to 9th place in March 2025. This period of volatility coincided with a decrease in sales from December 2024 to February 2025, followed by a rebound in March 2025. In comparison, Seattle Bubble Works maintained a relatively stable position, ranking 8th or 10th, while From the Soil consistently outperformed The Happy Cannabis, improving its rank to 8th by March 2025. Meanwhile, Hellavated consistently held a higher rank, indicating stronger sales performance. These dynamics suggest that while The Happy Cannabis remains a competitive player, it faces challenges from brands like From the Soil and Hellavated, which have shown more stable or improving trends in both rank and sales.

Notable Products
In March 2025, The Happy Cannabis saw Death By Candy Infused Pre-Roll 2-Pack (1g) reclaim the top spot in sales, demonstrating a significant increase from February, with sales reaching 1693 units. Fruit of the Gods Infused Pre-Roll 2-Pack (1g) climbed to the second position, showing a notable improvement from the fourth rank in February. Sex On The Beach Infused Pre-Roll 2-Pack (1g) dropped to third place, despite maintaining strong sales performance. Laughing Gas Infused Pre-Roll 2-Pack (1g) re-entered the rankings at fourth, after not being ranked in February, indicating a resurgence in popularity. Wake 'N' Bake Cookies Pre-Roll 2-Pack (1g) rounded out the top five, experiencing a slight decline from its previous third position.
Top Selling Cannabis Brands
Data for this report comes from real-time sales reporting by participating cannabis retailers via their point-of-sale systems, which are linked up with Headset’s business intelligence software. Headset’s data is very reliable, as it comes digitally direct from our partner retailers. However, the potential does exist for misreporting in the instance of duplicates, incorrectly classified products, inaccurate entry of products into point-of-sale systems, or even simple human error at the point of purchase. Thus, there is a slight margin of error to consider. Brands listed on this page are ranked in the top twenty within the market and product category by total retail sales volume.

