Mar-2025
Sales
Trend
6-Month
Product Count
SKUs
Overview
Market Insights Snapshot
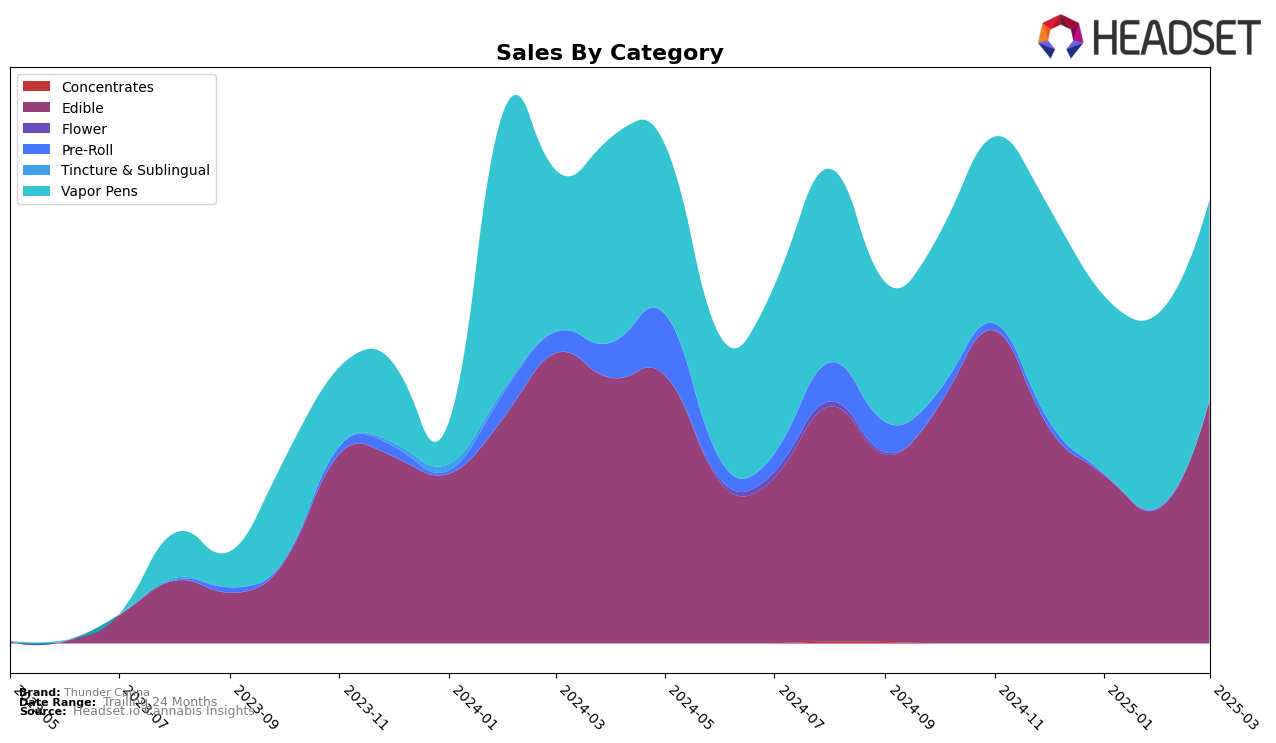
Thunder Canna's performance in the Michigan market has shown notable fluctuations across different product categories. In the Edible category, the brand experienced a significant climb in rankings, moving from the 36th position in February 2025 to 22nd in March 2025. This upward movement is particularly impressive given that they were not in the top 30 in February, suggesting a strategic shift or successful campaign that resonated with consumers. Conversely, the Vapor Pens category has been more stable, with Thunder Canna hovering around the mid-30s in ranking. Although they were not in the top 30 for any of the months analyzed, the sales figures indicate a slight increase from February to March, hinting at potential growth opportunities.
Sales data further underscores Thunder Canna's dynamic presence in Michigan. Despite a dip in Edible sales from December 2024 to February 2025, there was a notable recovery in March 2025, with sales reaching $313,399. This recovery suggests effective market strategies or product offerings that aligned well with consumer preferences. On the other hand, Vapor Pens showed a more gradual sales trend, with a modest increase from January to March 2025. This trend might indicate a steady consumer base, but the absence from the top 30 rankings suggests that more aggressive marketing or product innovation could be necessary to capture a larger market share.
Competitive Landscape
In the competitive Michigan edible market, Thunder Canna has demonstrated a notable fluctuation in its ranking over the past few months, reflecting a dynamic competitive landscape. Starting at rank 28 in December 2024, Thunder Canna experienced a decline to rank 36 in February 2025, before making a significant recovery to rank 22 by March 2025. This recovery is particularly impressive given the presence of strong competitors such as Magic Edibles, which consistently maintained a rank around 20, and High Minded, which showed a downward trend from rank 15 to 21. Meanwhile, Gelato demonstrated a notable improvement from rank 34 to 23, indicating a competitive push in the market. Thunder Canna's sales trajectory, with a significant increase in March 2025, suggests a successful strategic adjustment, potentially capturing market share from competitors like Mitten Extracts, which remained relatively stable but outside the top 20. This dynamic shift highlights Thunder Canna's resilience and adaptability in a highly competitive environment.
```
Notable Products
In March 2025, Thunder Canna's top-performing product was Strong Strawberry Gummies 10-Pack (200mg), maintaining its number one rank from February with impressive sales of $20,492. Magnificent Mango Gummies 10-Pack (200mg) emerged as a strong contender, debuting at the second position. Sour Groovy Grape Gummies 10-Pack (200mg) saw a slight drop, moving from second in February to third in March. Classic Cherry Gummies 10-Pack (200mg) climbed to fourth place, up from an unranked position in February. Glorious Green Apple Gummies 10-Pack (200mg) experienced a slight decline, dropping from third in February to fifth in March.
Top Selling Cannabis Brands
Data for this report comes from real-time sales reporting by participating cannabis retailers via their point-of-sale systems, which are linked up with Headset’s business intelligence software. Headset’s data is very reliable, as it comes digitally direct from our partner retailers. However, the potential does exist for misreporting in the instance of duplicates, incorrectly classified products, inaccurate entry of products into point-of-sale systems, or even simple human error at the point of purchase. Thus, there is a slight margin of error to consider. Brands listed on this page are ranked in the top twenty within the market and product category by total retail sales volume.

