Mar-2025
Sales
Trend
6-Month
Product Count
SKUs
Overview
Market Insights Snapshot
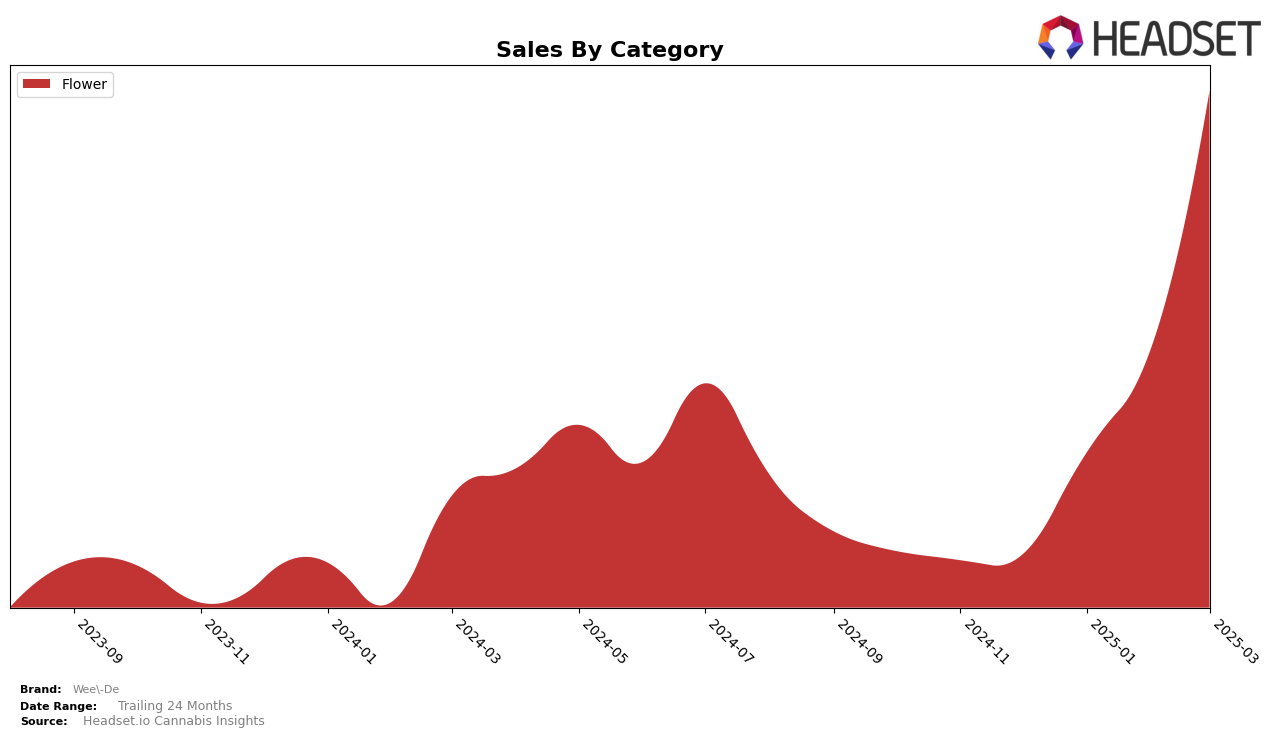
In the state of Massachusetts, Wee-De has shown a notable upward trajectory in the Flower category. Starting from outside the top 30 in December 2024, the brand climbed to rank 58 in January 2025 and continued its ascent to rank 39 by February. By March 2025, Wee-De had reached the 22nd position, indicating a significant increase in consumer interest and market penetration. This impressive rise suggests strategic moves or product offerings that have resonated well with Massachusetts consumers, although the specifics of these strategies remain undisclosed.
While the brand's progress in Massachusetts is commendable, it's important to note that Wee-De's absence from the top 30 rankings in December 2024 highlights the challenges it faced in gaining initial traction. The substantial leap to rank 22 by March, however, underscores a successful turnaround. The increase in sales from $162,325 in December to $521,367 in March reflects this positive trend. Observing such movements can provide insights into market dynamics and consumer preferences, although the particular factors driving these changes are not fully detailed here.
Competitive Landscape
In the Massachusetts flower category, Wee-De has shown a remarkable upward trajectory in the rankings from January to March 2025, moving from 58th to 22nd place. This significant climb in rank suggests a strong increase in market presence and consumer preference. In comparison, Old Pal experienced a decline, dropping from 13th to 20th place, indicating potential challenges in maintaining its market share. Meanwhile, Cloud Cover (C3) showed fluctuating ranks, ending at 23rd in March, which is close to Wee-De's position, suggesting a competitive rivalry. Nature's Heritage maintained a relatively stable position, hovering in the mid-20s, while INSA made a notable leap from 51st to 21st, closely paralleling Wee-De's rise. These dynamics highlight Wee-De's impressive growth and increasing competitiveness in the Massachusetts flower market, potentially driven by strategic marketing or product differentiation.

Notable Products
In March 2025, the top-performing product from Wee-De was Governmint Oasis (7g) in the Flower category, maintaining its rank as number one from February. Champaya (7g) rose to the second position with a notable increase in sales, reaching 1543 units. Orange Cookies X OG Kush (7g) climbed to third place, showing a significant jump from fifth in February, with sales figures at 1413 units. Almond Mochi (28g) and Banana Cake #20 (14g) entered the rankings for the first time in March, securing fourth and fifth positions, respectively. The data indicates a dynamic shift in product preferences, with new entries gaining traction among consumers.
Top Selling Cannabis Brands
Data for this report comes from real-time sales reporting by participating cannabis retailers via their point-of-sale systems, which are linked up with Headset’s business intelligence software. Headset’s data is very reliable, as it comes digitally direct from our partner retailers. However, the potential does exist for misreporting in the instance of duplicates, incorrectly classified products, inaccurate entry of products into point-of-sale systems, or even simple human error at the point of purchase. Thus, there is a slight margin of error to consider. Brands listed on this page are ranked in the top twenty within the market and product category by total retail sales volume.

