Jan-2025
Sales
Trend
6-Month
Product Count
SKUs
Overview
Market Insights Snapshot
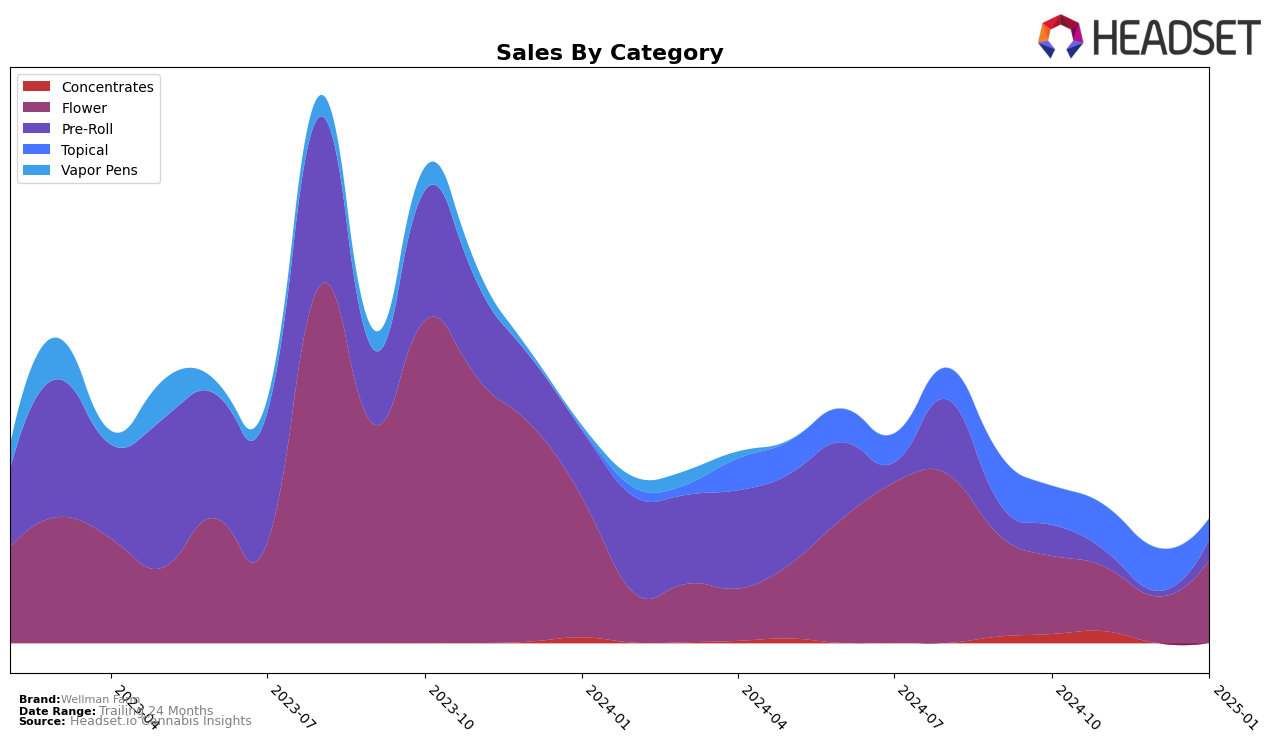
Wellman Farm has shown a steady performance in the Topical category within the state of Massachusetts. Over the months from October 2024 to December 2024, the brand maintained a strong presence, ranking consistently at 8th place for the first two months and improving slightly to 7th place in December. However, it's notable that Wellman Farm did not make it into the top 30 rankings in January 2025, which could indicate a shift in market dynamics or increased competition within the state. This absence from the rankings in January highlights a potential area of concern or opportunity for the brand to re-evaluate its strategy in the Massachusetts market.
Despite the drop in January rankings, Wellman Farm experienced a positive sales trend in Massachusetts, with sales increasing from $11,363 in October to $13,107 in November, before slightly decreasing to $12,559 in December. This upward trajectory in sales, especially during the holiday season, suggests effective consumer engagement and product acceptance. However, the lack of ranking data for January might imply that the brand's sales were not sufficient to maintain a top 30 position, warranting further analysis into consumer preferences and competitive actions during that period. Understanding these dynamics could be crucial for Wellman Farm to regain its standing in the future months.
Competitive Landscape
In the Massachusetts topical cannabis market, Wellman Farm has shown a slight upward trend in its ranking, moving from 8th place in October and November 2024 to 7th place by December 2024. This improvement in rank, despite not being in the top 20 by January 2025, suggests a competitive landscape where Wellman Farm is gaining traction. Notably, Avexia maintains a consistent presence in the top 5, while Doctor Solomon's held a strong 3rd position in October 2024 but did not appear in the top 20 in the following months. This fluctuation among competitors highlights the dynamic nature of the market and suggests opportunities for Wellman Farm to capitalize on shifts in consumer preferences and competitive positioning to further enhance its market share.

Notable Products
In January 2025, Wellman Farm's top-performing product was Papaya Purple Punch Pre-Roll (1g) in the Pre-Roll category, climbing from the fifth position in the previous two months to first place with impressive sales of 290 units. Northern Lights #5 (3.5g) maintained a strong presence in the Flower category, holding steady in second place with sales of 286 units. Bananaconda (3.5g) entered the rankings for the first time, securing third place in the Flower category. Bananaconda Pre-Roll (1g) reappeared in the Pre-Roll category, achieving fourth place, a slight decline from its previous third-place ranking in October 2024. Lastly, Mango Haze (3.5g) made its debut in January 2025, capturing the fifth position in the Flower category.
Top Selling Cannabis Brands
Data for this report comes from real-time sales reporting by participating cannabis retailers via their point-of-sale systems, which are linked up with Headset’s business intelligence software. Headset’s data is very reliable, as it comes digitally direct from our partner retailers. However, the potential does exist for misreporting in the instance of duplicates, incorrectly classified products, inaccurate entry of products into point-of-sale systems, or even simple human error at the point of purchase. Thus, there is a slight margin of error to consider. Brands listed on this page are ranked in the top twenty within the market and product category by total retail sales volume.


