Mar-2025
Sales
Trend
6-Month
Product Count
SKUs
Overview
Market Insights Snapshot
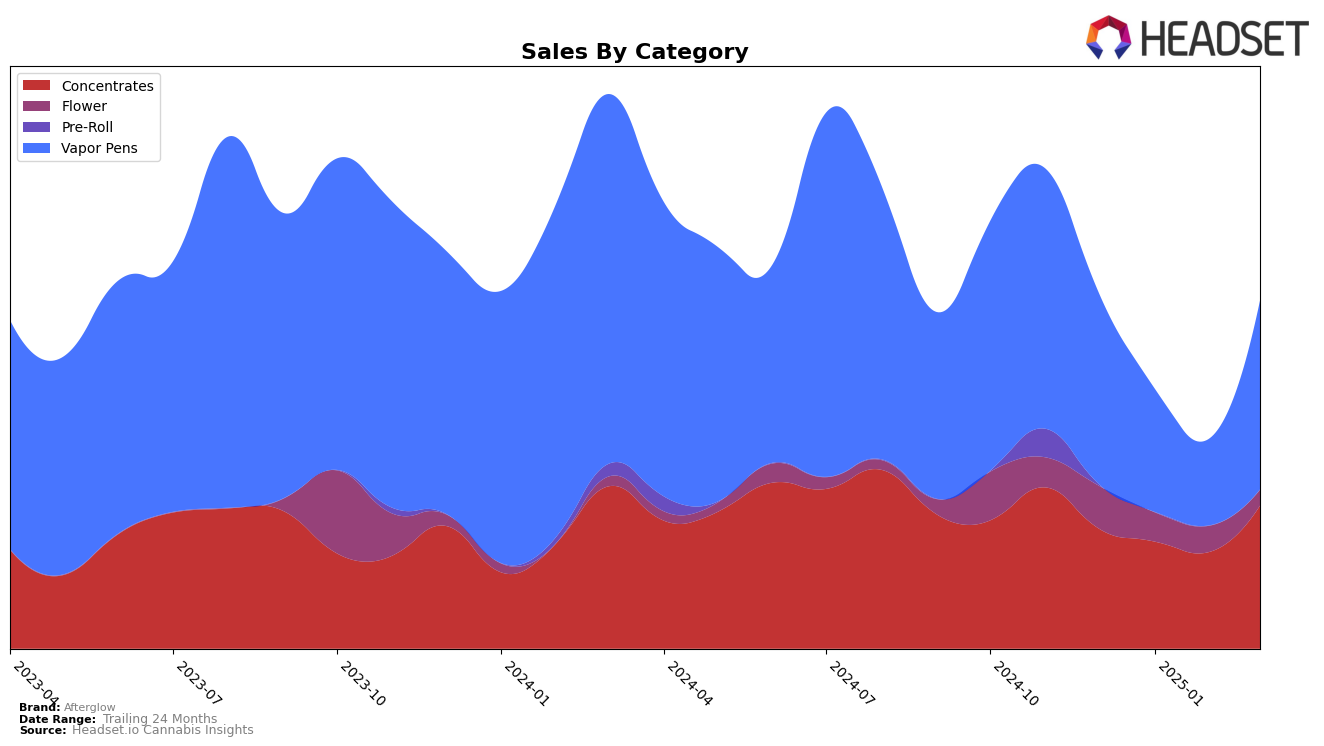
In the state of Oregon, Afterglow has shown a notable upward trend in the Concentrates category. Starting from a position outside the top 30 in December 2024, the brand managed to climb to 29th place by March 2025. This improvement is significant, especially considering the sales spike in March, which suggests a successful strategy or product launch. However, in the Vapor Pens category, Afterglow has struggled to maintain a consistent ranking, fluctuating from 45th in December to 57th in February, before returning to 45th in March. This inconsistency might indicate challenges in market penetration or consumer retention within this category.
The absence of Afterglow from the top 30 in the Vapor Pens category across multiple months highlights a potential area for growth or reevaluation. Despite this, the brand's resurgence in March suggests there might be underlying factors or initiatives that are beginning to take effect. The overall sales figures for Concentrates in March 2025, which saw a significant increase, hint at a possible shift in consumer preference or a successful promotional campaign. While the details of these initiatives remain undisclosed, the data suggests a complex landscape where Afterglow is striving to find its footing across different product categories in Oregon.
Competitive Landscape
In the Oregon Vapor Pens category, Afterglow has experienced notable fluctuations in its ranking and sales performance over the past few months. Starting at rank 45 in December 2024, Afterglow saw a decline to rank 50 in January 2025, and further dropped to rank 57 in February 2025, before rebounding back to rank 45 in March 2025. This volatility contrasts with competitors like Cannabis Nation INC, which maintained a stable position around rank 37, and Fire Dept. Cannabis, which improved its rank from 42 to 32 before settling at 39. Despite the rank fluctuations, Afterglow's sales showed a recovery in March, aligning closely with its December figures, although still trailing behind High Tech, which had a significant sales dip in January but managed to stabilize by March. These insights suggest that while Afterglow faces challenges in maintaining a consistent market position, there is potential for recovery and growth, especially if it can capitalize on its sales rebound and address the competitive pressures from more stable brands.

Notable Products
In March 2025, Afterglow's top-performing product was the Blackberry Jam Flavored Distillate Cartridge in the Vapor Pens category, which climbed to the number one rank with impressive sales of 1226 units. The Watermelon Wonder Botanical Sugar Wax in the Concentrates category secured the second spot, showing a significant rise from the fourth position in February 2025. Oregon Marionberry Sugar Wax, also in the Concentrates category, debuted in the rankings at third place. The Juicy Mango Distillate Cartridge, which was previously ranked first in January 2025, fell to fourth place in March. Notably, the Forbidden Fruit Distillate Flavored Cartridge entered the rankings at fifth place in March 2025.
Top Selling Cannabis Brands
Data for this report comes from real-time sales reporting by participating cannabis retailers via their point-of-sale systems, which are linked up with Headset’s business intelligence software. Headset’s data is very reliable, as it comes digitally direct from our partner retailers. However, the potential does exist for misreporting in the instance of duplicates, incorrectly classified products, inaccurate entry of products into point-of-sale systems, or even simple human error at the point of purchase. Thus, there is a slight margin of error to consider. Brands listed on this page are ranked in the top twenty within the market and product category by total retail sales volume.


