.svg)

Sep-2026
Sales
Trend
6-Month
Product Count
SKUs
Avg Price
YoY Sales Change
YoY Price Change


Where to Buy
Amnesia is stocked at 246 licensed dispensaries across Michigan, New York, and New Mexico, 233 of them in Michigan, with the deepest coverage in New Buffalo, Detroit, Monroe, Grand Rapids, and Inkster. Search by ZIP code or city below to find the closest one, or filter by product type if you are after a specific format.
Market Insights Snapshot
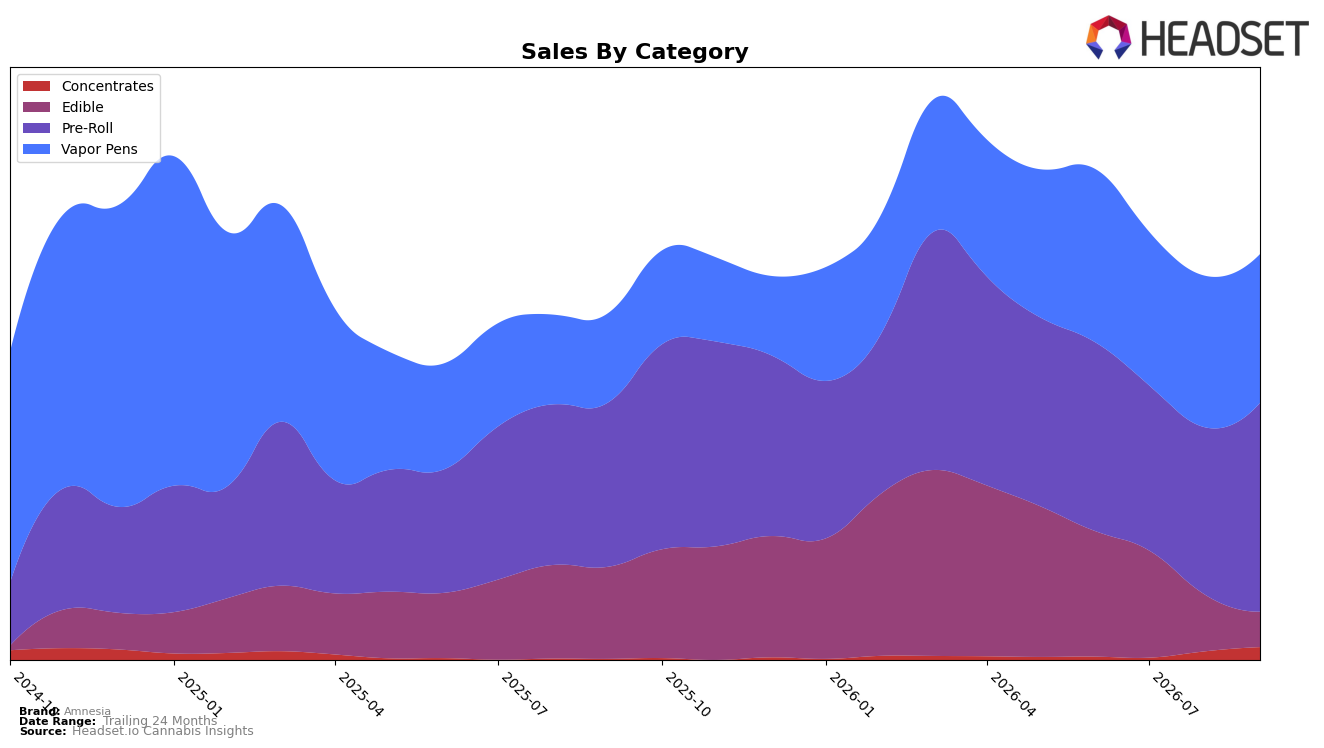
Amnesia concentrated half of September 2026 sales in Pre-Roll at 50.35% share, with year-over-year growth of 26.37% and month-over-month growth of 24.23%, while Vapor Pens held 36.17% share with a 63.45% year-over-year increase but a -1.78% month-over-month dip. Edible contracted to 9.37% share with -58.86% year-over-year and -35.16% month-over-month, as Concentrates, though only 4.11% share, surged 209.04% year-over-year and 32.51% month-over-month. In Michigan Pre-Roll, the brand sat at rank 21, and September 2026 average price rose 64.67% year over year alongside total brand sales up 16.18% year over year, indicating a mix shift toward higher-price segments while Vapor Pens paused month over month. The pattern implies Amnesia is leaning into Pre-Roll volume with a concurrent price upshift, while the Vapor Pens plateau and Edible retreat are reallocating demand toward Concentrates and reinforcing Pre-Roll leadership within the portfolio.
These shifts position Amnesia to compete on depth in Pre-Roll where a rank of 21 in Michigan can move with incremental share capture if the 24.23% month-over-month Pre-Roll growth sustains and the 64.67% brand-wide price lift is defended by pack architecture or potency cues; the -1.78% month-over-month in Vapor Pens suggests selective SKU pruning could protect margin without ceding core wallet share. With Edible shrinking by -58.86% year over year while Concentrates climb 209.04% year over year, the brand’s positioning tilts toward inhalables where cross-category trade-up from Edible can be converted, implying pricing power is being earned in Pre-Roll and Concentrates even as Vapor Pens serves as a stabilizer rather than a growth engine.
Competitive Landscape
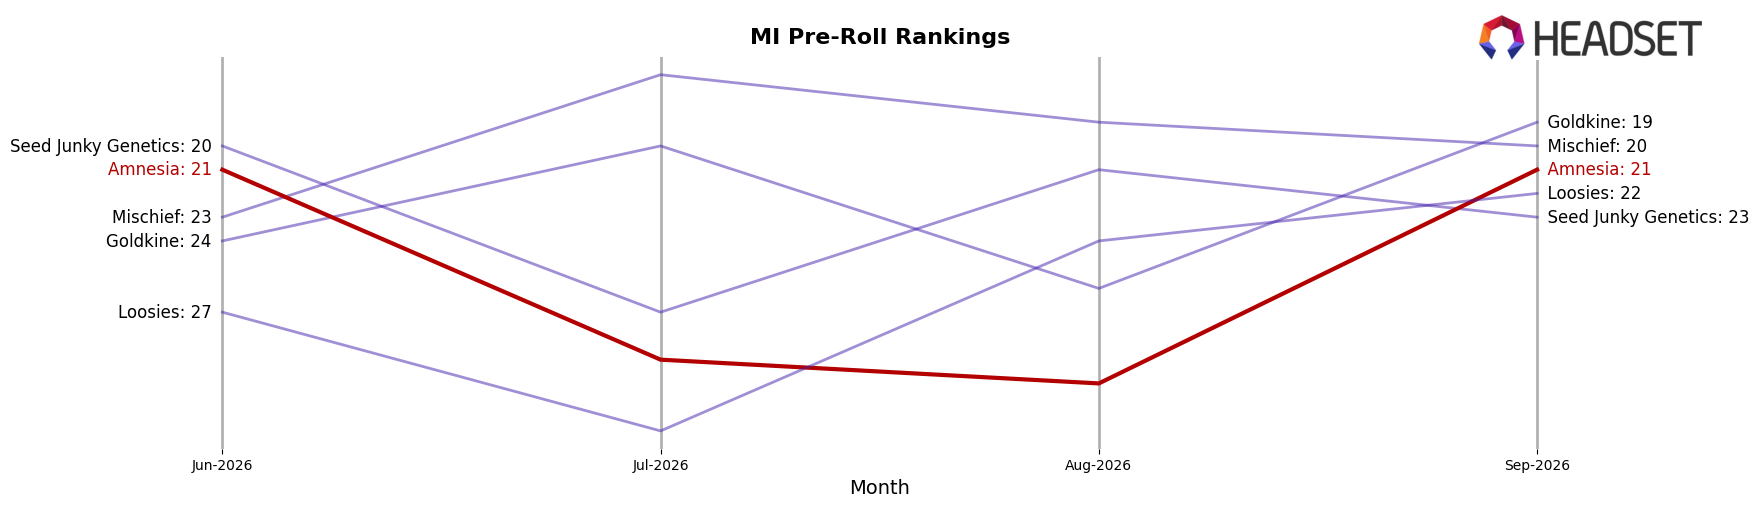
Amnesia sits at rank #21 in September 2026, down 1 position from #20 year over year, and unchanged versus June 2026 at #21, while still trailing its March 2026 peak of #14 by 7 spots; in contrast, Jeeter held #1 year over year and remains #1 now with approximately 149.9% YoY sales growth, and Cali-Blaze stayed at #2 despite a 36.1% YoY sales decline, indicating that Amnesia’s flat three-month rank at #21 alongside a modest YoY slip suggests a stall-out below the top 20 unless distribution or velocity shifts enough to reclaim ground toward its prior #14 ceiling.
Notable Products
Zerds - Pink Lemonade Hash Rosin Gummies 5-Pack (200mg) posted the steepest decline in September 2026 at -20.8% MoM while sliding to rank 6, and Cherry Pie Hash Rosin Zerds Gummies 5-Pack (200mg) fell -15.9% MoM at rank 1, signaling pressure at the top of the Edible set. Zerds -Orange Soda Hash Rosin Gummy (200mg) also dropped -10.6% MoM at rank 2, and Blueberry Pancake Distillate Cartridge (1g) declined -17.4% MoM at rank 10, whereas Fruity Pebbles Glass-Tip Bubble Hash Infused Pre-Roll (1.3g) limited losses to -3.8% at rank 3. With four of the top ten in Pre-Roll and four in Edible, the mix tilts toward inhalables for stability and away from Zerds gummies for momentum, implying Amnesia’s commercial direction depends on leaning into Pre-Roll resilience while triaging Edible churn.
Top Selling Cannabis Brands






Data for this report comes from real-time sales reporting by participating cannabis retailers via their point-of-sale systems, which are linked up with Headset’s business intelligence software. Headset’s data is very reliable, as it comes digitally direct from our partner retailers. However, the potential does exist for misreporting in the instance of duplicates, incorrectly classified products, inaccurate entry of products into point-of-sale systems, or even simple human error at the point of purchase. Thus, there is a slight margin of error to consider. Brands listed on this page are ranked in the top twenty within the market and product category by total retail sales volume.

