Mar-2025
Sales
Trend
6-Month
Product Count
SKUs
Overview
Market Insights Snapshot
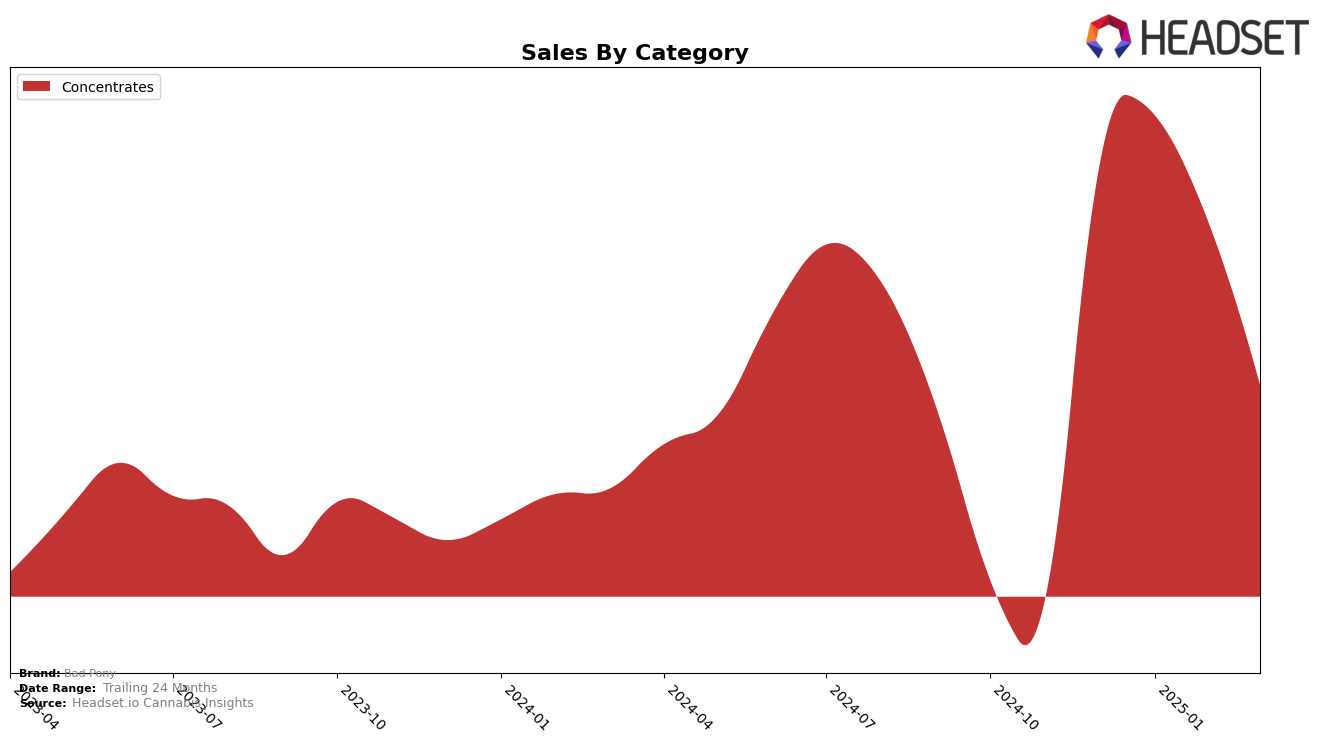
Bad Pony's performance in the Concentrates category in Missouri has shown a downward trend over the first quarter of 2025. Starting at rank 17 in December 2024, Bad Pony slipped to rank 25 by March 2025. This decline in ranking is mirrored by a decrease in sales, with March 2025 sales figures significantly lower than those in December 2024. The brand's inability to maintain its position within the top 20 by the end of March is indicative of increased competition or a shift in consumer preferences within the Missouri market.
While Bad Pony's decline in Missouri's Concentrates category is notable, the absence of the brand from the top 30 in other states and categories suggests challenges in expanding its market presence beyond Missouri. This could highlight a need for strategic adjustments in marketing or product offerings to capture a broader audience. The data points to potential areas for growth if the brand can leverage its existing market knowledge and consumer insights to improve its standings in other regions. However, further analysis would be required to understand the underlying factors affecting Bad Pony's performance across different markets and categories.
Competitive Landscape
In the Missouri concentrates market, Bad Pony has experienced a notable shift in its competitive positioning from December 2024 to March 2025. Initially ranked 17th in December 2024, Bad Pony has seen a decline in rank, dropping to 25th by March 2025. This downward trend in rank is mirrored by a decrease in sales, with a significant drop from January to March 2025. In contrast, Origin Extracts has maintained a relatively stable position, improving from 23rd to 21st, and experiencing an upward trend in sales by March 2025. Meanwhile, Safe Bet and Monopoly Melts have shown improvements in their rankings, with Safe Bet climbing from 27th to 23rd and Monopoly Melts from 37th to 26th, both reflecting positive sales trajectories. The competitive landscape indicates that Bad Pony may need to reassess its strategies to regain its standing and address the sales decline in this dynamic market.

Notable Products
In March 2025, the top-performing product from Bad Pony was Frosted Apricots Live Diamonds (1g) in the Concentrates category, which secured the number one rank. Bunny Runtz Diamonds (1g) climbed to the second position, showing notable resilience with sales of 214 units. Piescream Live Badder (1g) dropped to third place from its previous top rank in February. By The Dawgs Live Diamonds (1g) emerged in the rankings, securing the fourth spot. By The Dawgs Live Badder (1g) experienced a decline, moving from second place in January to fifth in March.
Top Selling Cannabis Brands
Data for this report comes from real-time sales reporting by participating cannabis retailers via their point-of-sale systems, which are linked up with Headset’s business intelligence software. Headset’s data is very reliable, as it comes digitally direct from our partner retailers. However, the potential does exist for misreporting in the instance of duplicates, incorrectly classified products, inaccurate entry of products into point-of-sale systems, or even simple human error at the point of purchase. Thus, there is a slight margin of error to consider. Brands listed on this page are ranked in the top twenty within the market and product category by total retail sales volume.

