Aug-2024
Sales
Trend
6-Month
Product Count
SKUs
Overview
Market Insights Snapshot
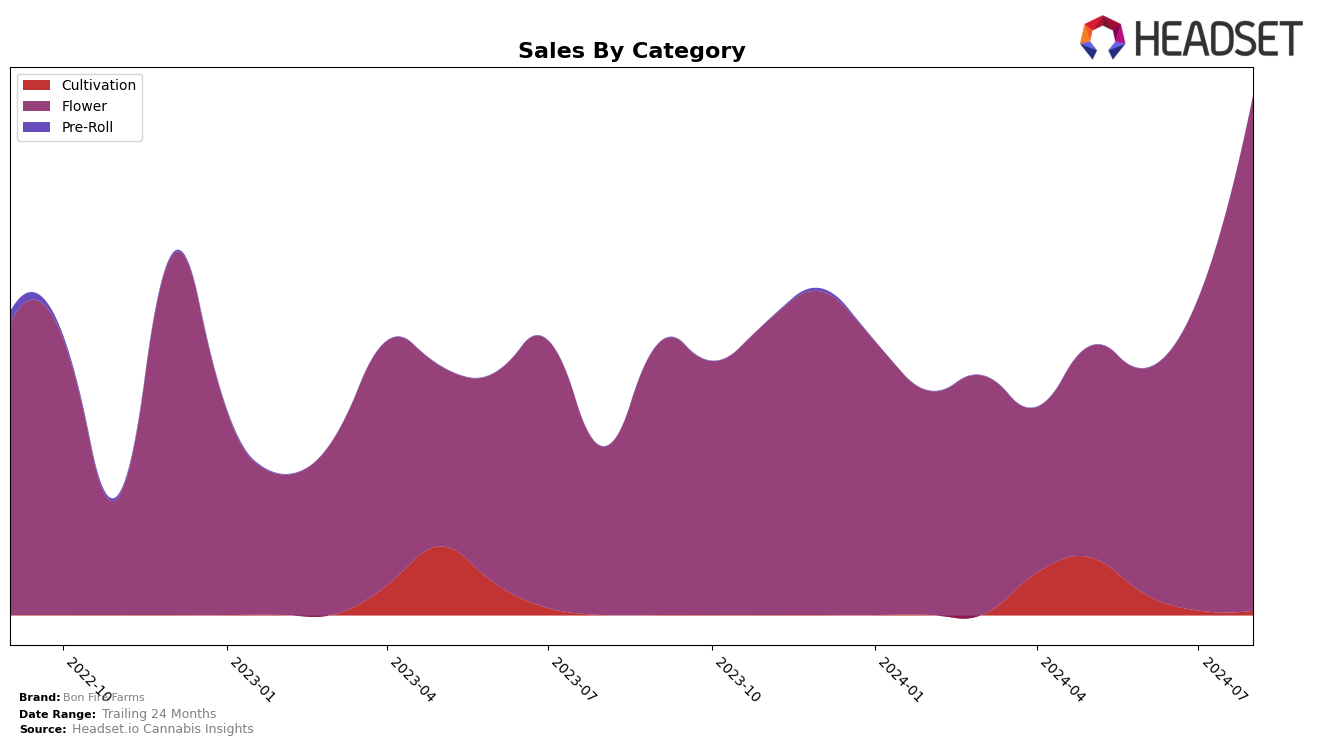
Bon Fire Farms has shown a notable upward trajectory in the Flower category within Oregon. Starting from a position outside the top 30 in May 2024, the brand climbed to 29th place by August 2024. This movement indicates a significant increase in market presence and consumer demand, as evidenced by a substantial rise in sales from $101,916 in May to $256,821 in August. The brand's consistent improvement each month suggests a growing recognition and acceptance among Oregon consumers, positioning Bon Fire Farms as a rising competitor in the Flower category.
While the brand's performance in Oregon is impressive, its absence from the top 30 rankings in other states and categories highlights areas for potential growth and market penetration. The lack of top 30 rankings in other regions could be seen as a challenge, but it also represents an opportunity for Bon Fire Farms to expand its footprint and diversify its market strategy. By leveraging its success in Oregon, the brand could explore similar growth strategies in other states, potentially replicating its upward trend and capturing new market segments.
Competitive Landscape
In the competitive landscape of the Oregon flower category, Bon Fire Farms has shown a remarkable upward trajectory in recent months, climbing from a rank of 78 in May 2024 to an impressive 29 by August 2024. This significant improvement in rank indicates a strong increase in market presence and consumer preference. Comparatively, SugarTop Buddery experienced fluctuations, peaking at rank 18 in July but dropping to 34 by August, suggesting potential volatility in their market performance. Meanwhile, Sticky Farms and Summary Farms also saw notable rank improvements, with Sticky Farms rising to 30 and Summary Farms to 28 in August. However, Quantum Oregon demonstrated the most consistent growth, reaching rank 27 in August. The competitive dynamics suggest that while Bon Fire Farms is rapidly gaining ground, it faces stiff competition from brands like Quantum Oregon and Summary Farms, which are also on upward trends. This competitive analysis underscores the importance of continuous market monitoring to capitalize on emerging opportunities and sustain growth.

Notable Products
In August 2024, Peanutbutter Macslurry (1g) emerged as the top-performing product for Bon Fire Farms, significantly increasing its sales to 2217 units. Purple Truffles (Bulk) maintained a strong position, ranking second with notable consistency, improving from fifth place in June to second in both July and August. Black Cherry Diamonds #6 (1g) experienced a slight decline, dropping from first place in July to third in August, with sales reaching 789 units. New entries Tongue Splasher #6 (14g) and 100K (1g) secured the fourth and fifth positions respectively, indicating a positive reception in the market. Overall, August saw significant shifts in product rankings, with substantial sales growth for the leading products.
Top Selling Cannabis Brands
Data for this report comes from real-time sales reporting by participating cannabis retailers via their point-of-sale systems, which are linked up with Headset’s business intelligence software. Headset’s data is very reliable, as it comes digitally direct from our partner retailers. However, the potential does exist for misreporting in the instance of duplicates, incorrectly classified products, inaccurate entry of products into point-of-sale systems, or even simple human error at the point of purchase. Thus, there is a slight margin of error to consider. Brands listed on this page are ranked in the top twenty within the market and product category by total retail sales volume.

