Mar-2025
Sales
Trend
6-Month
Product Count
SKUs
Overview
Market Insights Snapshot
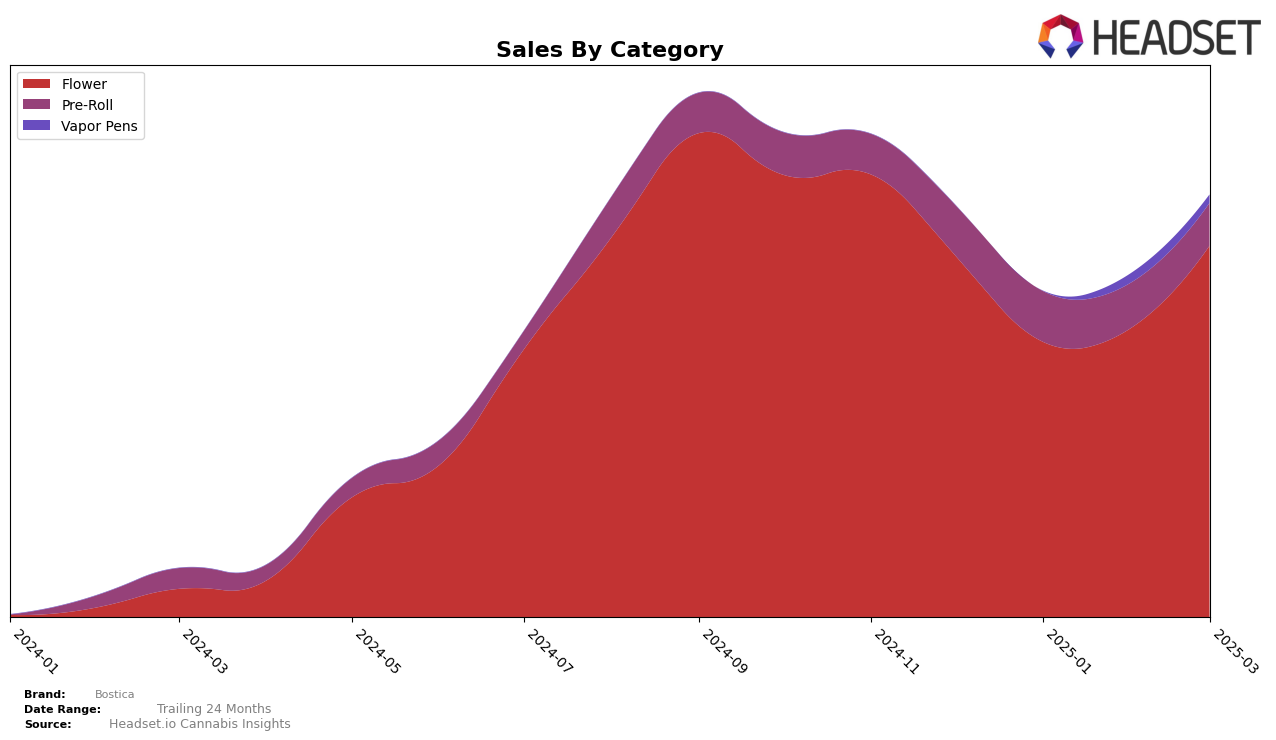
Bostica has demonstrated a notable performance in the Massachusetts market, particularly in the Flower category. The brand's ranking improved from 15th in December 2024 to 12th in March 2025, indicating a positive trajectory in this category. This upward movement is reflected in their sales, which increased from $625,656 in February to $804,866 in March. In contrast, Bostica's performance in the Pre-Roll category has been less consistent, with rankings fluctuating and ultimately dropping to 59th in March 2025 from a high of 49th in February. This suggests potential challenges in maintaining a competitive edge in the Pre-Roll category, despite a slight increase in sales from December to January.
In the Vapor Pens category, Bostica's presence in the Massachusetts market has been relatively recent, as they only appeared in the rankings starting February 2025. Their entry at 93rd place in February, followed by a slight decline to 99th in March, indicates that while they have managed to break into the top 100, there is still significant room for growth. The absence of prior rankings in this category highlights the challenges Bostica faces in gaining a foothold in the Vapor Pens market. This initial foray into the category, however, may provide valuable insights and opportunities for strategic adjustments to improve their standing in the coming months.
Competitive Landscape
In the competitive landscape of the Massachusetts flower category, Bostica has shown a dynamic performance over the past few months, with its rank fluctuating from 15th in December 2024 to 12th by March 2025. This upward trend is indicative of a positive shift in market presence, although it still faces stiff competition from brands like Kynd Cannabis Company, which consistently remains in the top 10, and Eleven, which also improved its rank, moving from 13th to 11th in the same period. Meanwhile, Cresco Labs has made a significant leap from being outside the top 20 in December to 13th in March, suggesting a rapid increase in sales and market penetration. Bostica's sales have seen a recovery from a dip in January, aligning with its improved rank, but it still trails behind the sales figures of the leading competitors, indicating room for growth and the potential impact of strategic marketing efforts to capture a larger market share.

Notable Products
In March 2025, Apples & Bananas (3.5g) emerged as the top-performing product for Bostica, climbing from its previous absence in rankings to secure the number one spot, with impressive sales of 6487. Drip (3.5g) maintained a strong presence, though it slipped from first in February to second place. Red Line - Cap Junky (3.5g) consistently held its ground in third place, showing steady sales growth. Gush Mints (3.5g) improved slightly from February, moving from fourth to fourth position with a notable increase in sales. Jet Fuel (3.5g), a new entrant in February, remained in the top five, albeit dropping one spot to fifth in March.
Top Selling Cannabis Brands
Data for this report comes from real-time sales reporting by participating cannabis retailers via their point-of-sale systems, which are linked up with Headset’s business intelligence software. Headset’s data is very reliable, as it comes digitally direct from our partner retailers. However, the potential does exist for misreporting in the instance of duplicates, incorrectly classified products, inaccurate entry of products into point-of-sale systems, or even simple human error at the point of purchase. Thus, there is a slight margin of error to consider. Brands listed on this page are ranked in the top twenty within the market and product category by total retail sales volume.

